Can RSP Reverse its Relative Downtrend? 📈 The Chart Report

Chart of the Day
🏆 Today's Chart of the Day was shared by Broc Losing.
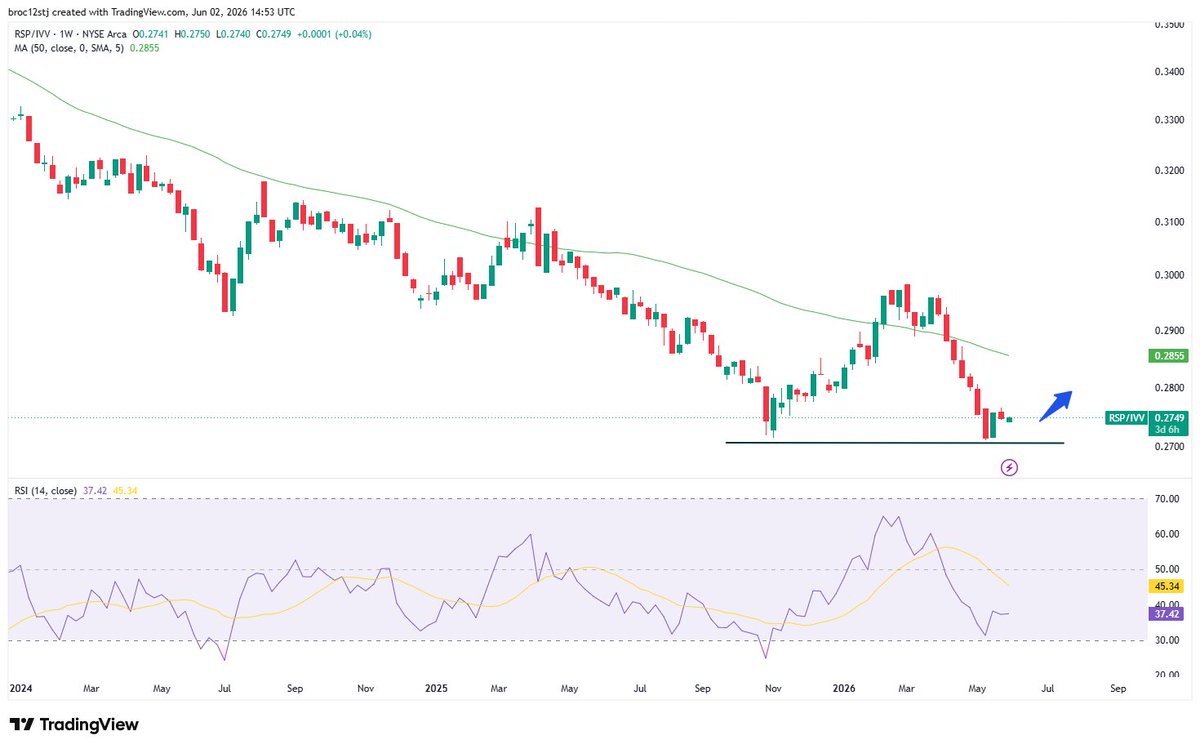
The Equal Weight S&P 500 (RSP) is testing its pivot lows against its cap-weighted counterpart after recently matching its longest weekly relative losing streak since 2008.
In our morning note we wrote about how the S&P 500 Ex-Tech ETF (SPXT) was unable to hold its prior highs, and since the March lows, the percentage of S&P 500 Tech stocks outperforming the broader index has climbed to its highest levels in recent years.
Meanwhile, the percentage of S&P 500 stocks outperforming the index over the past two months is at its third-lowest reading since 1972, underscoring the extreme gap between tech leadership and the rest of the market.
The Takeaway: The dispersion among technology and the rest of the market has rarely been wider, as the Equal Weight S&P 500 tests a critical relative support level.
More Great Charts
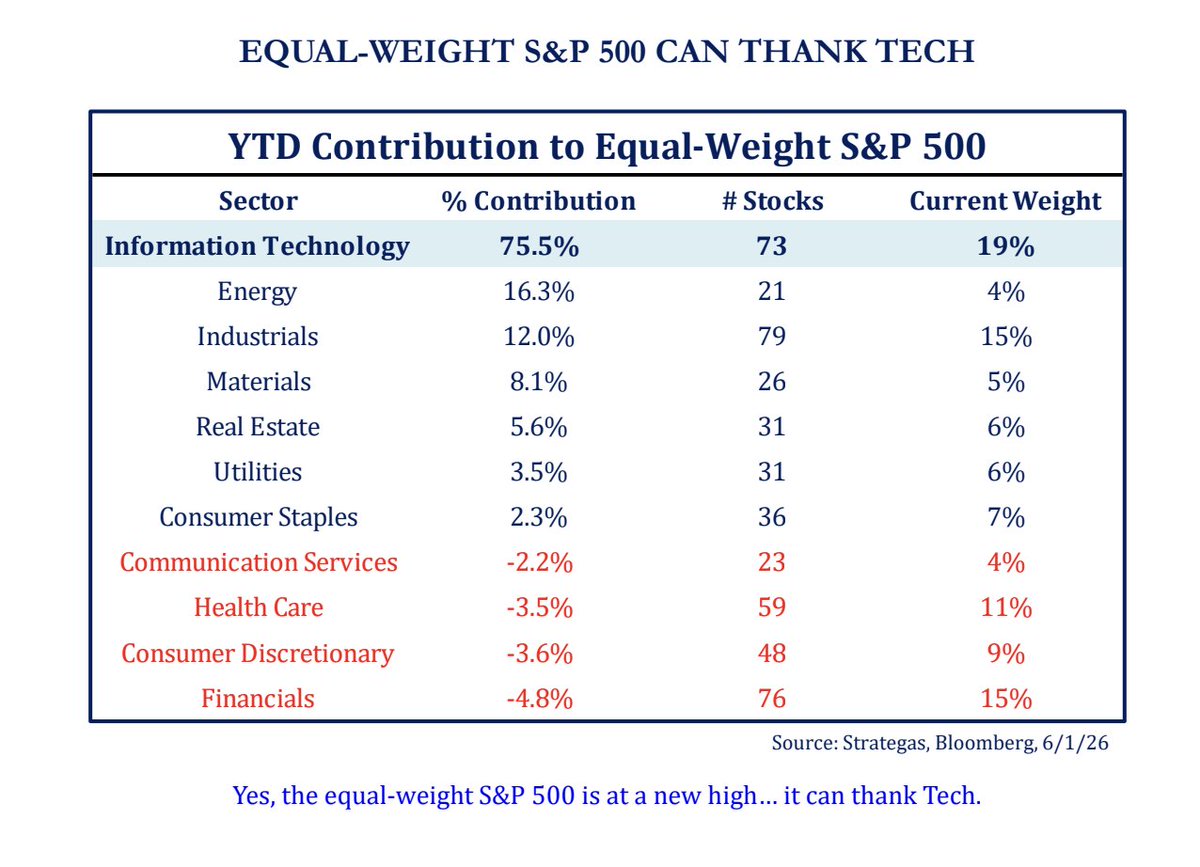
Even within the Equal-Weight S&P 500, technology has been responsible for the vast majority of year-to-date gains.
See the full tweet from Josh Schafer via research from Todd Sohn.
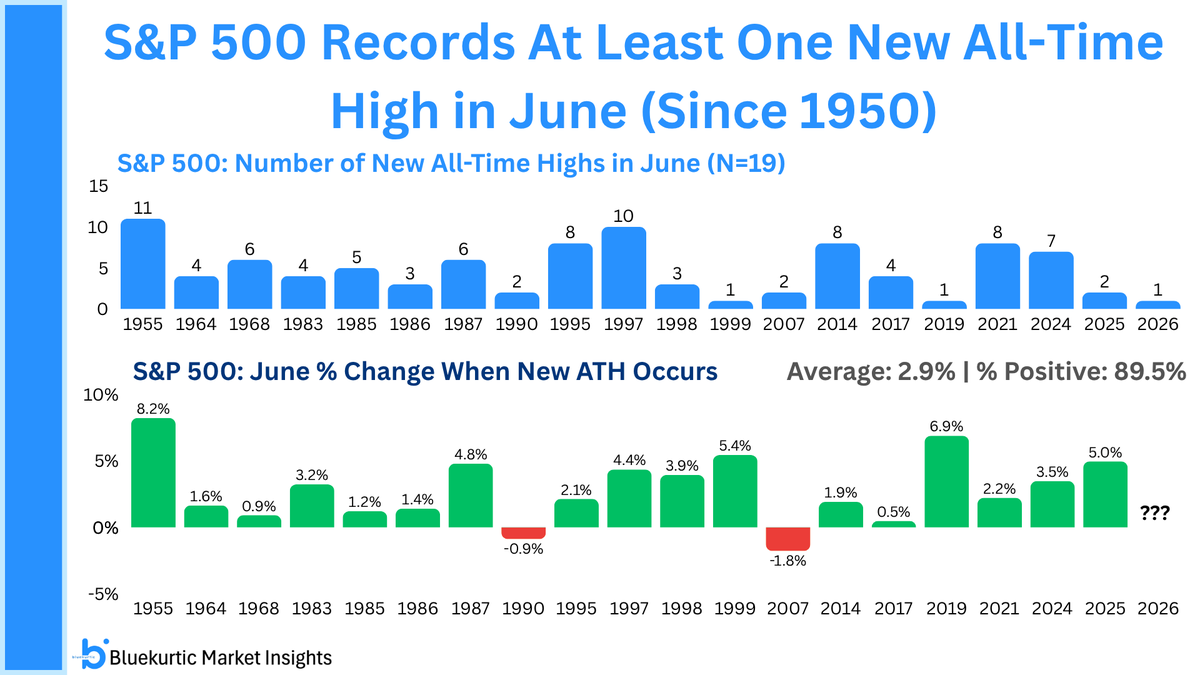
When the S&P 500 makes a new all-time high during June, the month has tended to finish higher with an average gain of roughly 3%.
View the entire post from Bluekurtic.
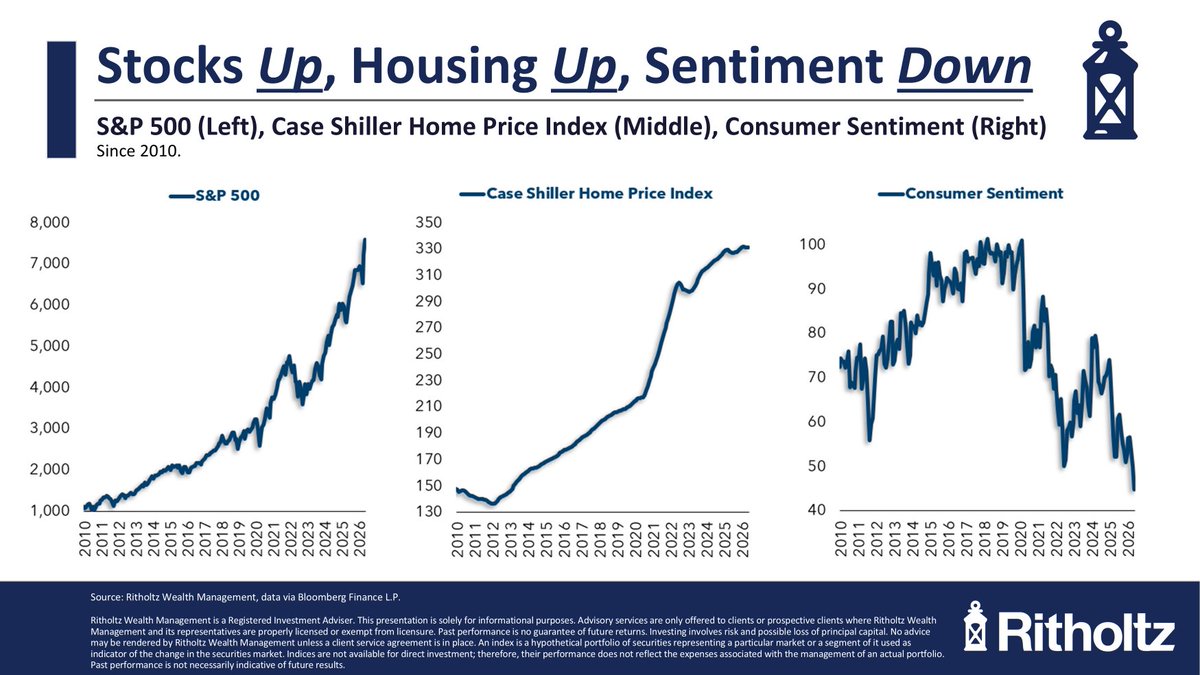
Despite strong gains in both stocks and housing this decade, consumer sentiment is at record lows.
Examine the whole tweet Ben Carlson.
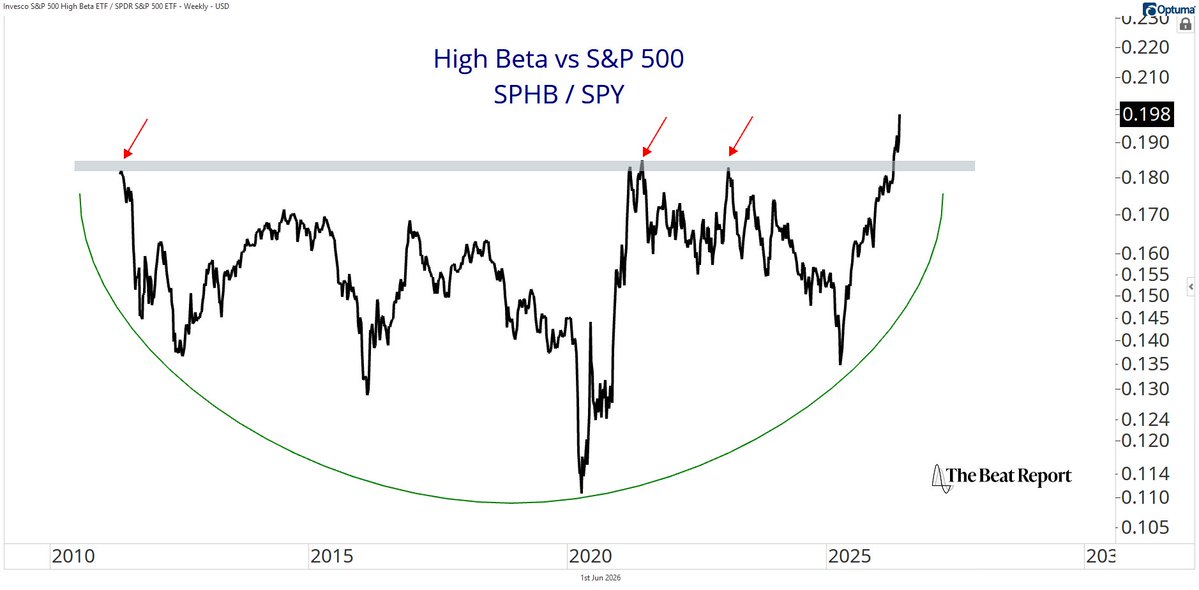
High Beta stocks are making new all-time highs versus the S&P 500.
Check out the complete post from Steve Strazza.
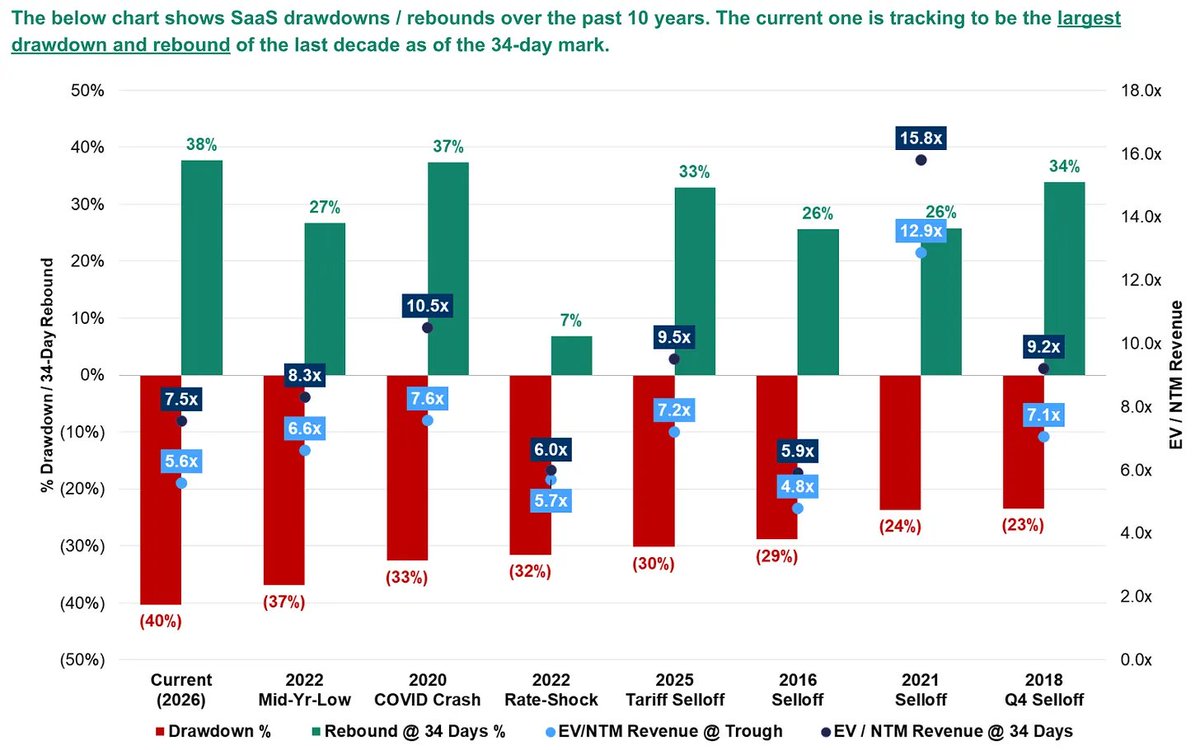
Few rallies have been as dramatic as the recent rebound in SaaS stocks, which recovered nearly all of a 40% decline in just 34 sessions.
View the entire tweet from Julian Klymochko.
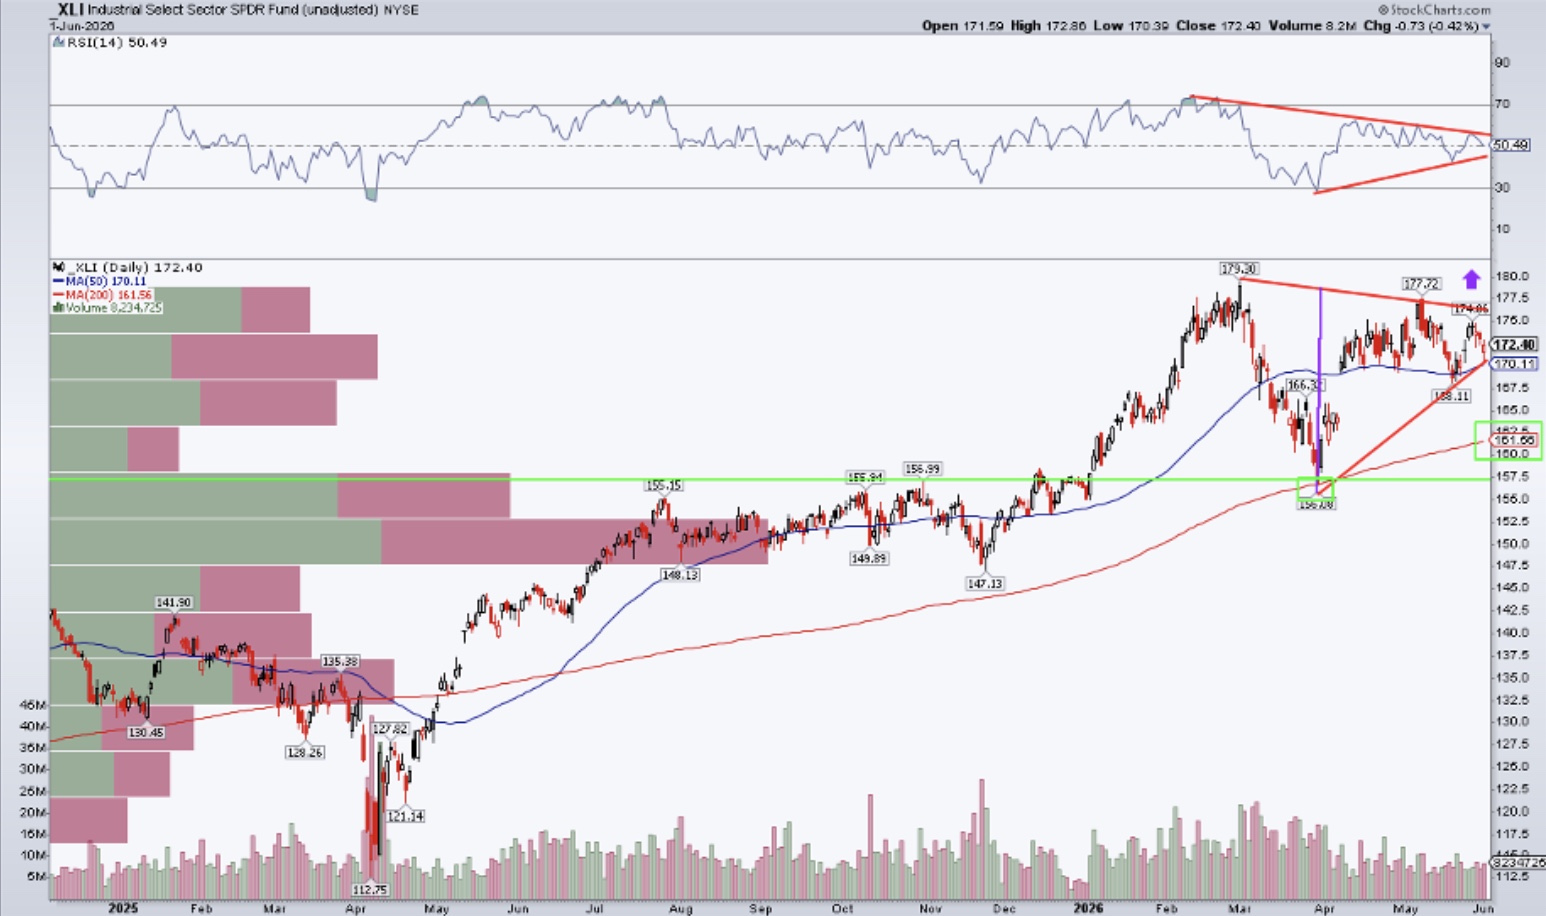
Industrials continue to coil beneath resistance, with a breakout above $178 opening the door toward $200.
Read the full analysis from Mike Zaccardi.
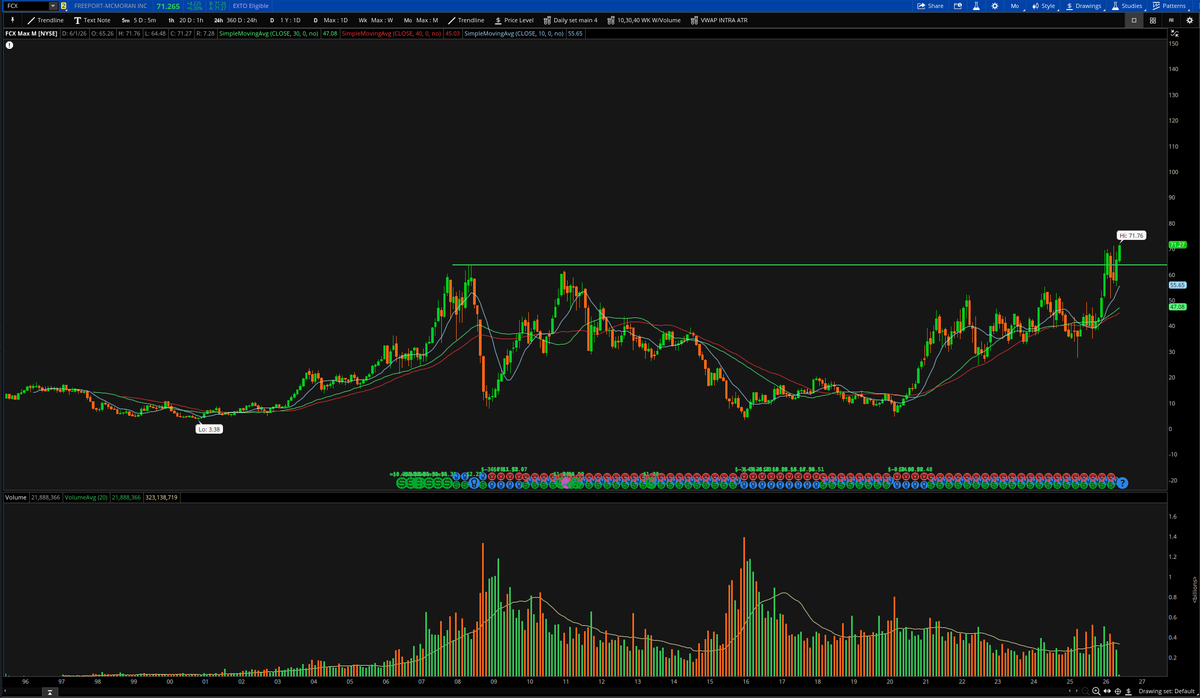
With copper pushing to fresh all-time highs, Freeport-McMoRan (FCX) is emerging from a multi-decade base.
See the complete post from Connor Bates.
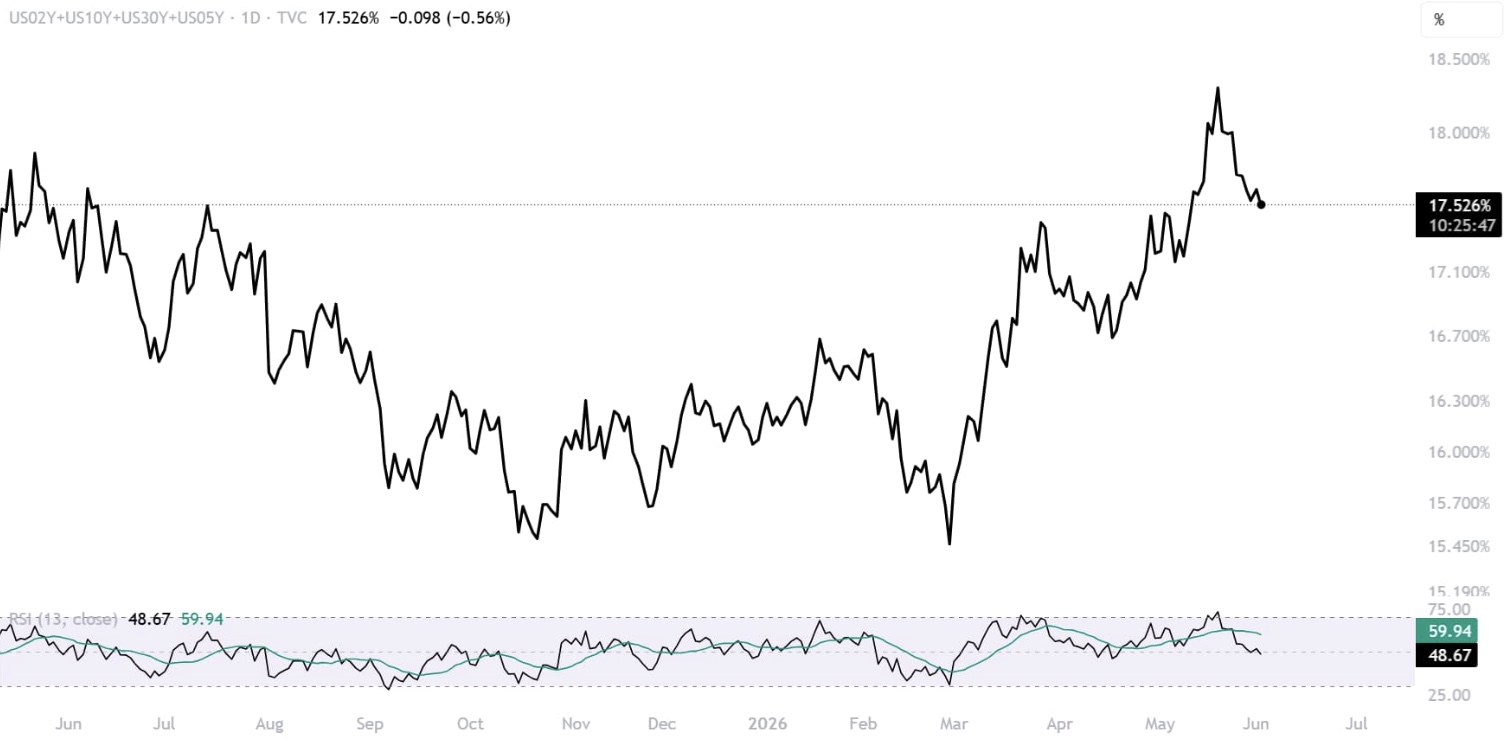
Treasury yields have retreated meaningfully from their yearly highs after reaching overbought momentum conditions.
Explore the latest article from Razan Hilal.
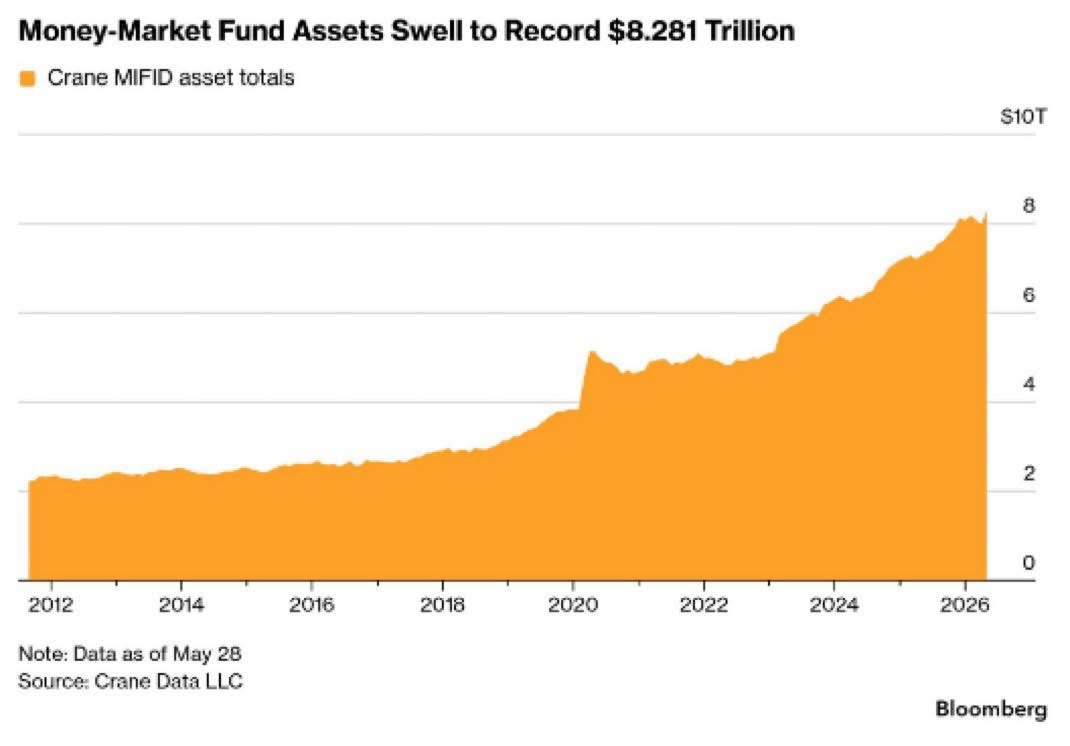
Money market fund assets have climbed to a record $8.28 trillion.
View the whole tweet from TreasuryBonds.com
The Chart Report curates best-in-class technical analysis from across the web.
If you’d like to share a chart or just say hello, email us at [email protected]