Four Inflation Signals to Watch ⚠️ The Chart Report

Chart of the Day
🏆 Today's Chart of the Day was shared by Arun Chopra.
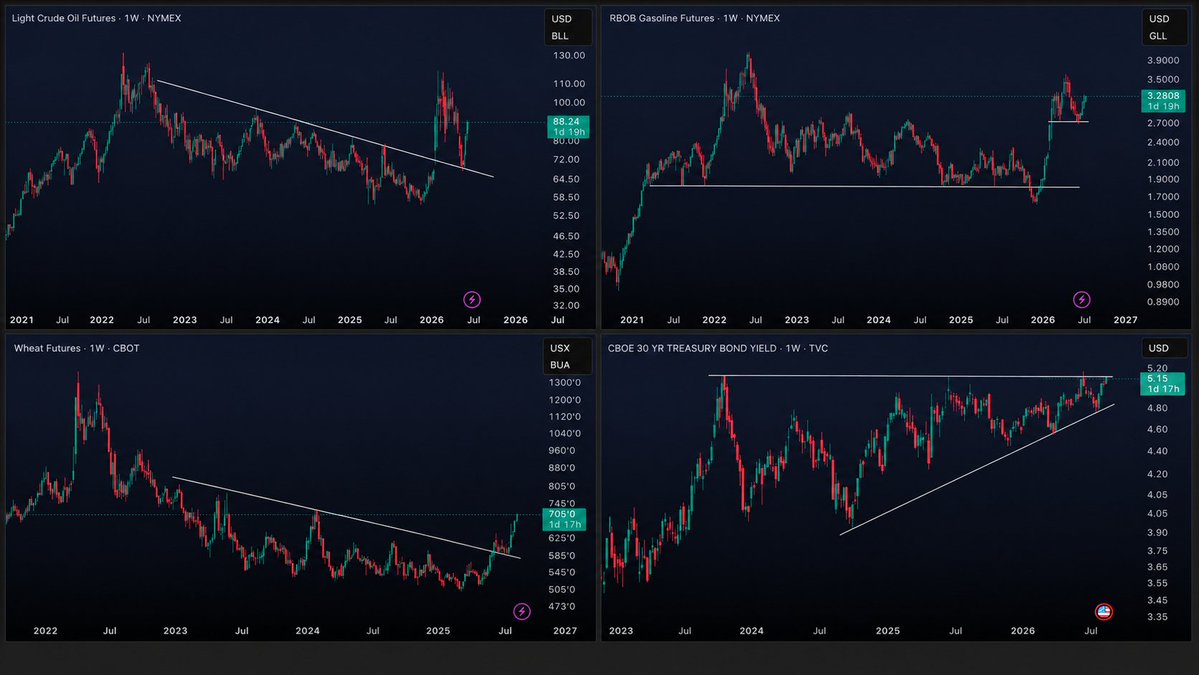
Inflation-sensitive areas are back in the headlines, with crude oil, gasoline, agricultural commodities, and the U.S. 30-Year Treasury Yield all gaining momentum over the past week.
The move in long-term yields has been especially noteworthy, as the 30-Year attempts to break out from a massive multi-year ascending triangle and is on track for its highest weekly close since 2007.
Investors have grown accustomed to the secular downtrend in interest rates, but a breakout here would signal that the path of least resistance has shifted higher.
The Takeaway: These four charts may be the market's biggest headwinds.
More Great Charts
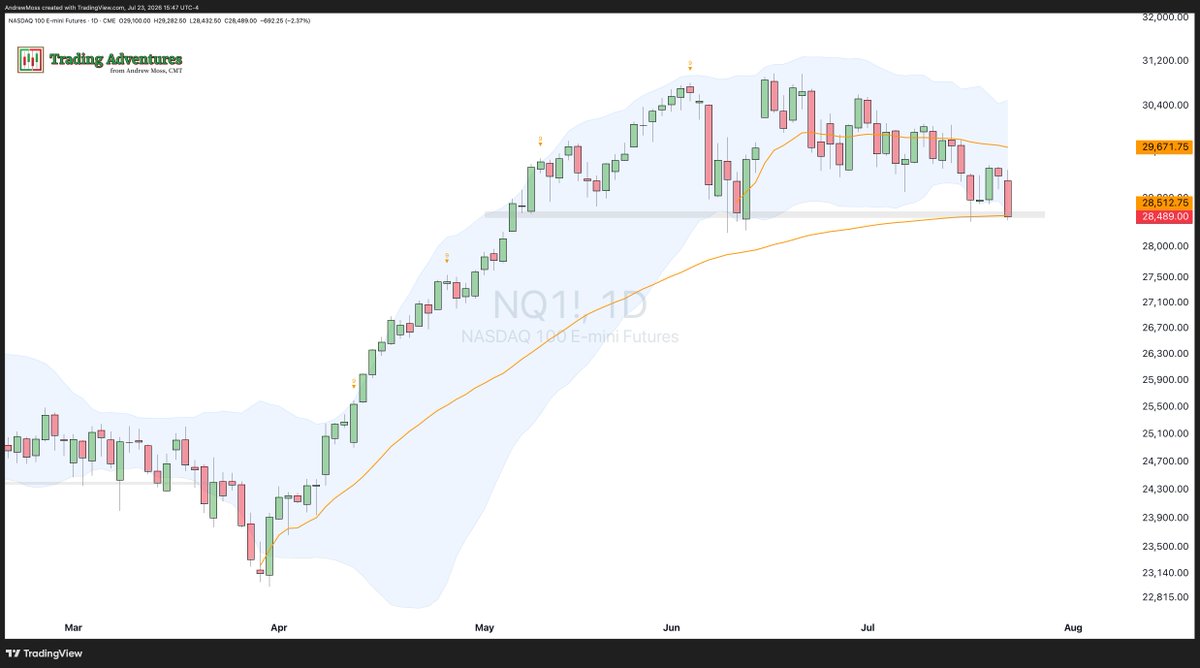
Nasdaq 100 Futures are testing the anchored VWAP from the March lows, along with horizontal support near $28.5k.
See the full tweet from Andrew Moss.
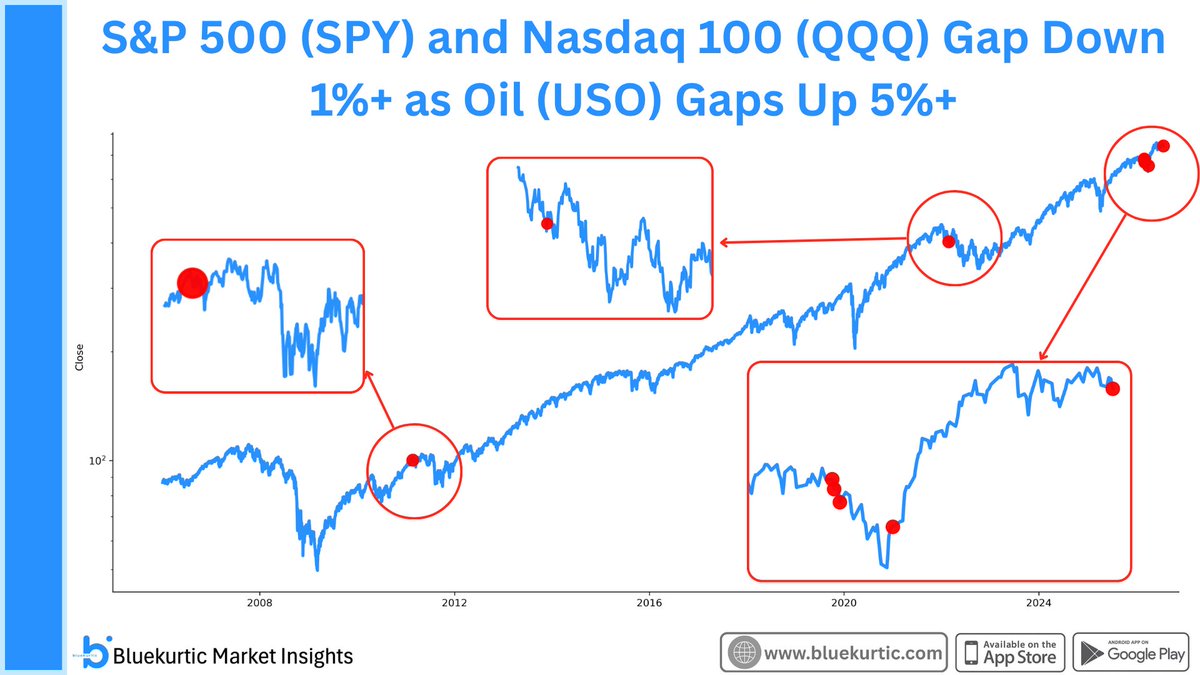
Only seven times in the past 20 years have the S&P 500 and Nasdaq 100 both gapped down more than 1% while Crude Oil gapped up more than 5%.
Six of those instances preceded major market drawdowns, while one led to a recovery.
Check out the whole post from Bluekurtic.
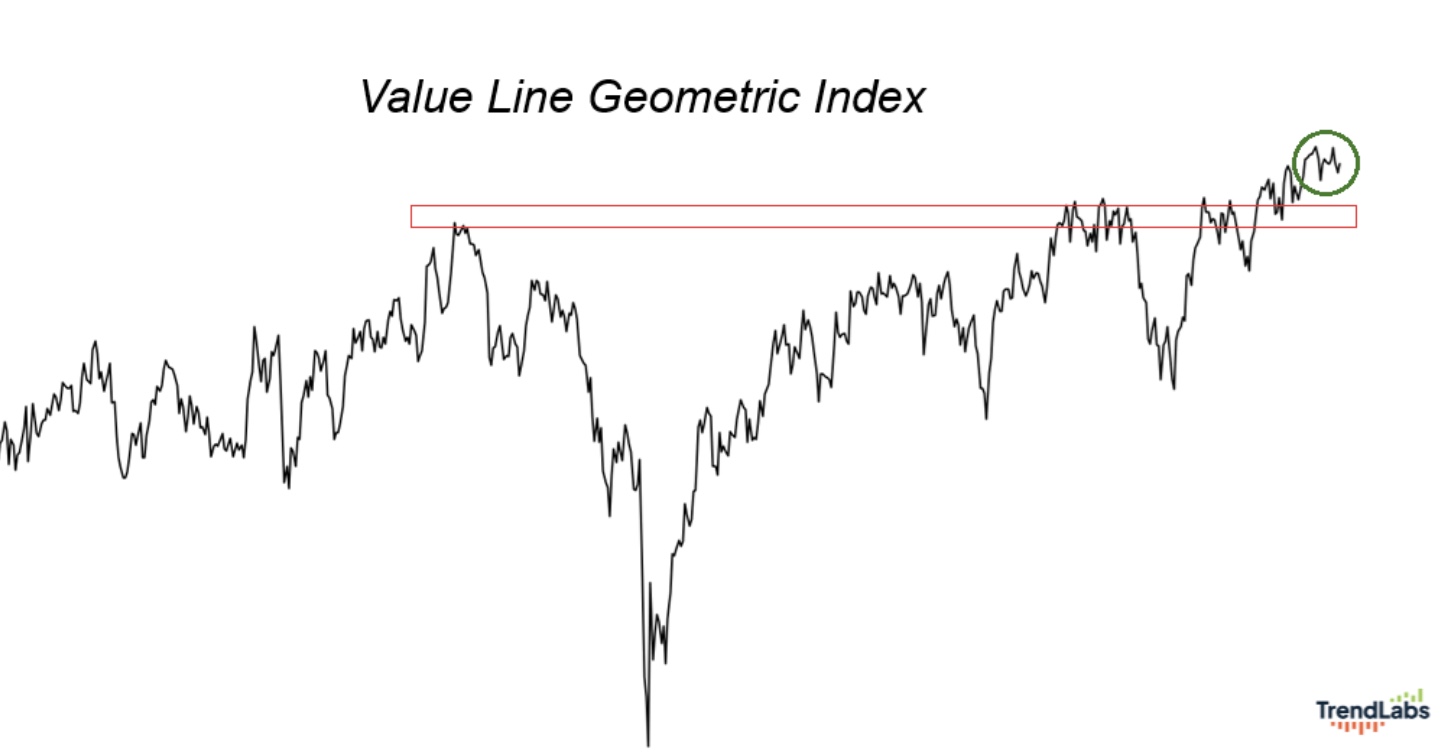
The Value Line Geometric Index continues to hold above its prior breakout level.
Read the complete analysis from J.C. Parets.
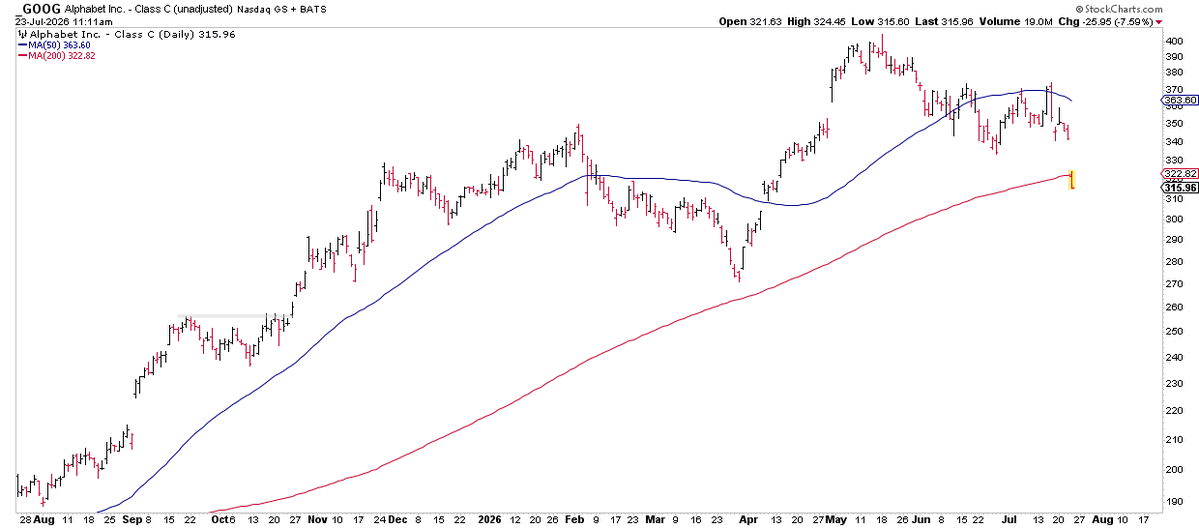
Google has gapped below its long-term 200-day moving average.
View the entire tweet from David Rath.
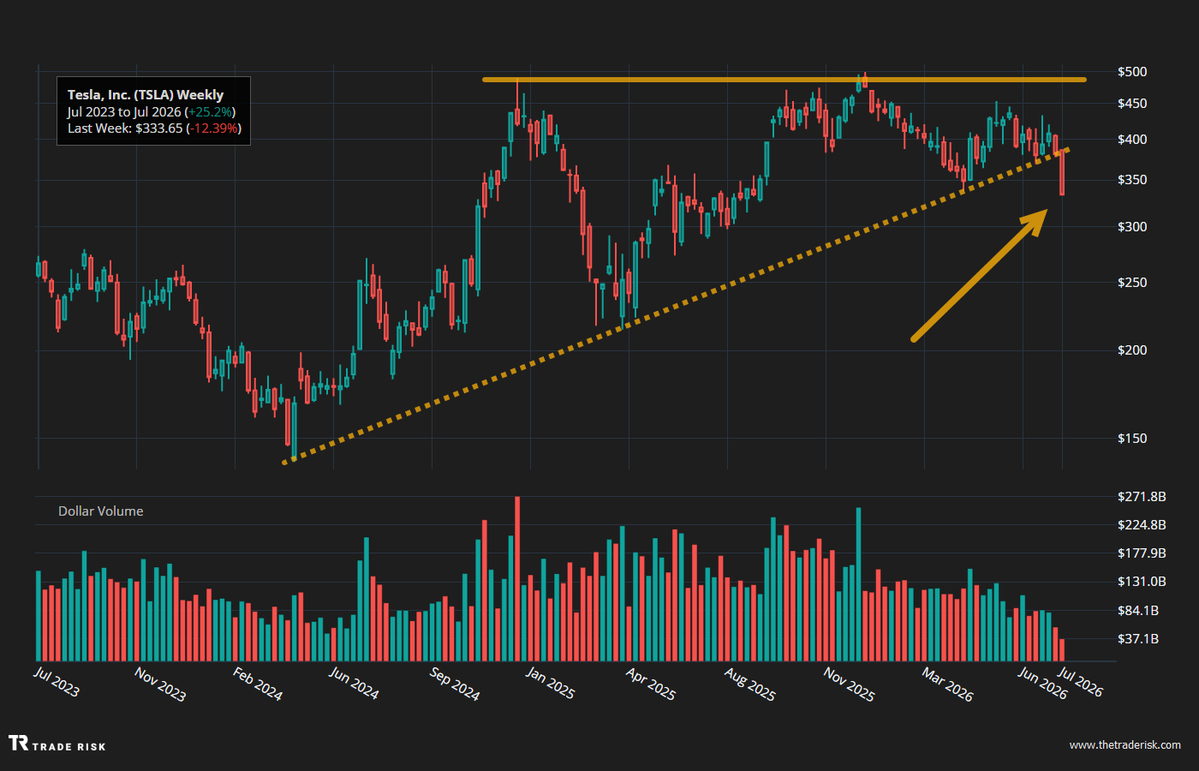
Tesla has broken down from its multi-year trendline, leaving behind what appears to be a failed ascending triangle.
Examine the full post from Evan Medeiros.
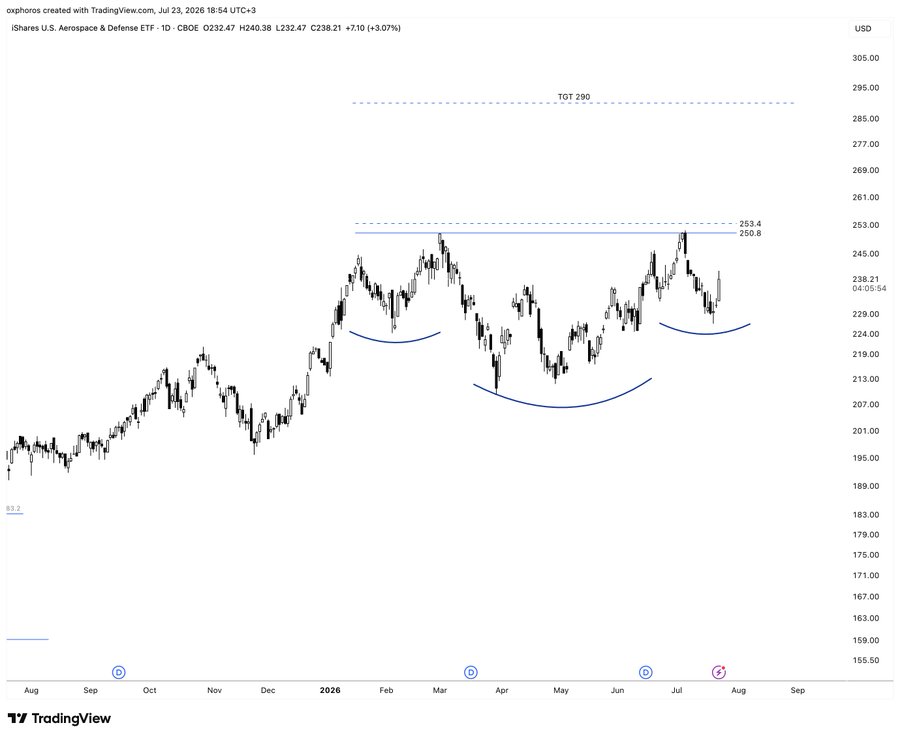
Aerospace & Defense stocks caught a bid today following positive earnings reactions from Lockheed Martin (LMT) and Raytheon (RTX).
See the whole tweet from PhorosOxBeta.
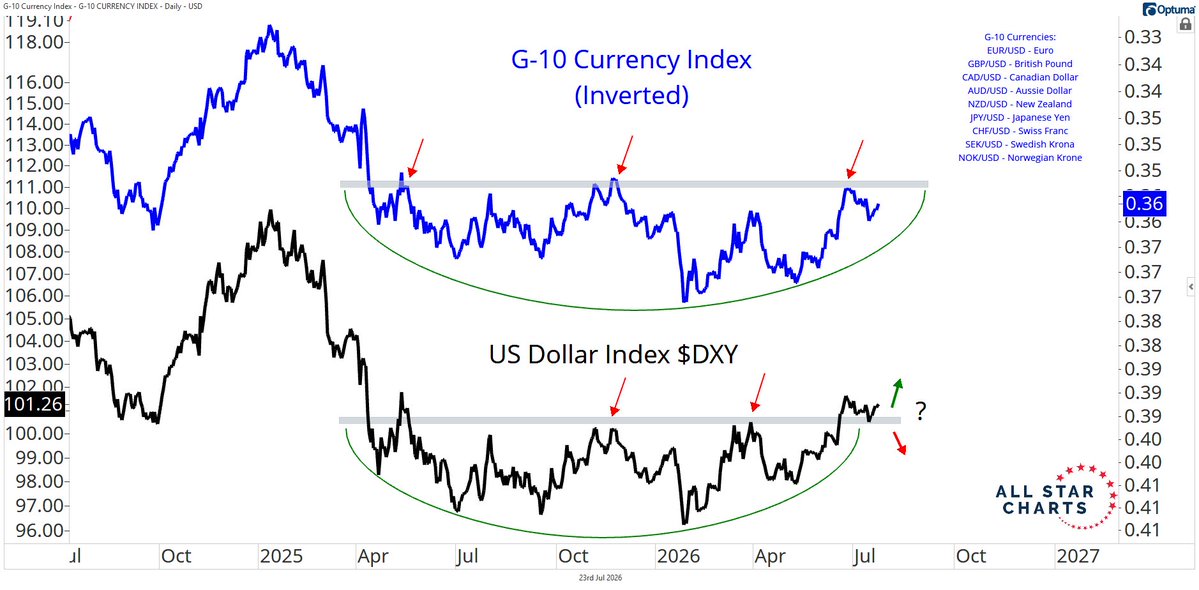
The move higher in the Dollar Index has been fueled primarily by weakness in $EUR and $JPY, while the dollar remains range-bound when measured against a broader G-10 equal-weight basket.
View the complete post from Steven Strazza.
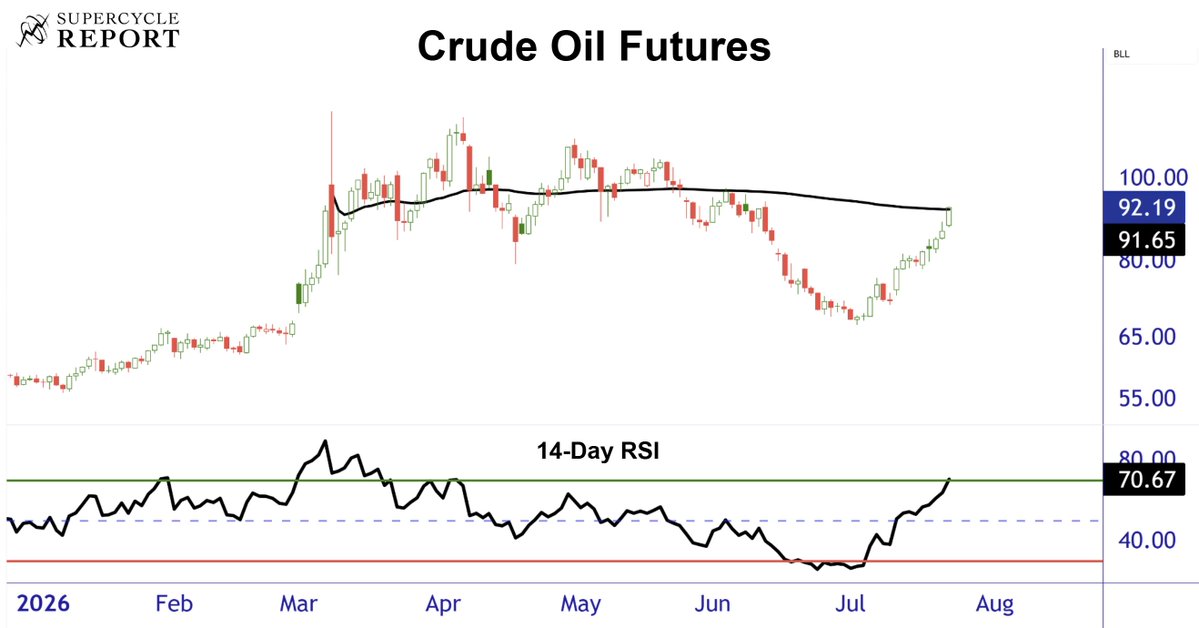
Crude Oil futures are reclaiming a key anchored VWAP while momentum moves into overbought territory.
Check out the entire tweet from Sam Gatlin.
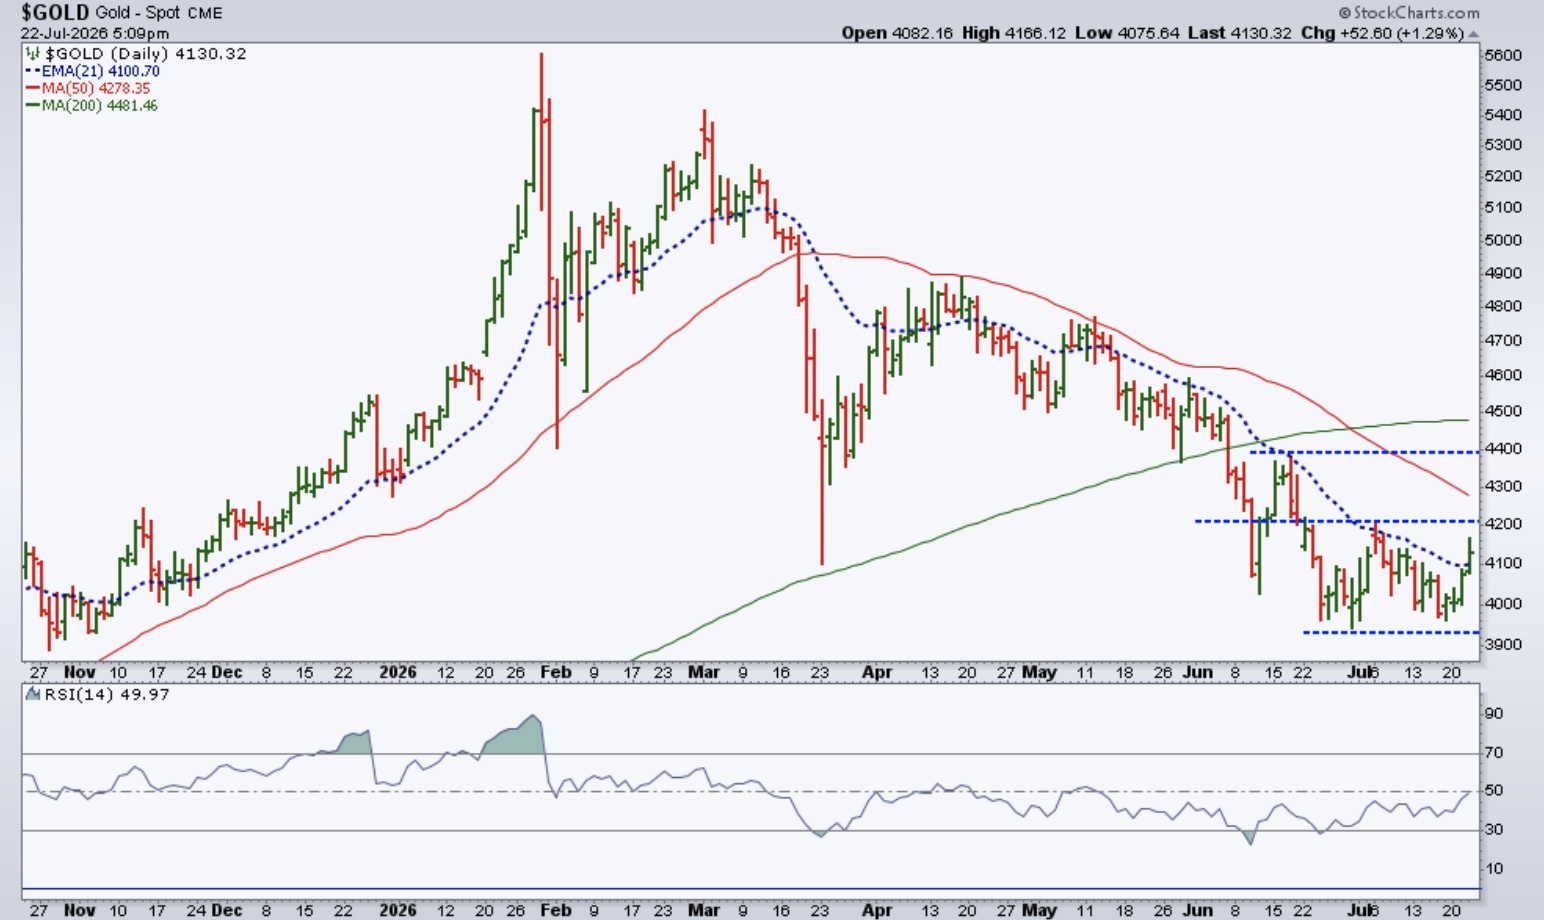
The trend in Gold remains lower, but a move above the 50-day moving average accompanied by an RSI reading above 60 would provide strong evidence of improving momentum.
Read the full analysis from Jayanthi Gopalakrishnan.
The Chart Report curates best-in-class technical analysis from across the web.
If you’d like to share a chart or just say hello, email us at [email protected]