The Path to SPX 8000 📈 The Chart Report

Chart of the Day
🏆 Today's Chart of the Day was shared by The Orion Engine.
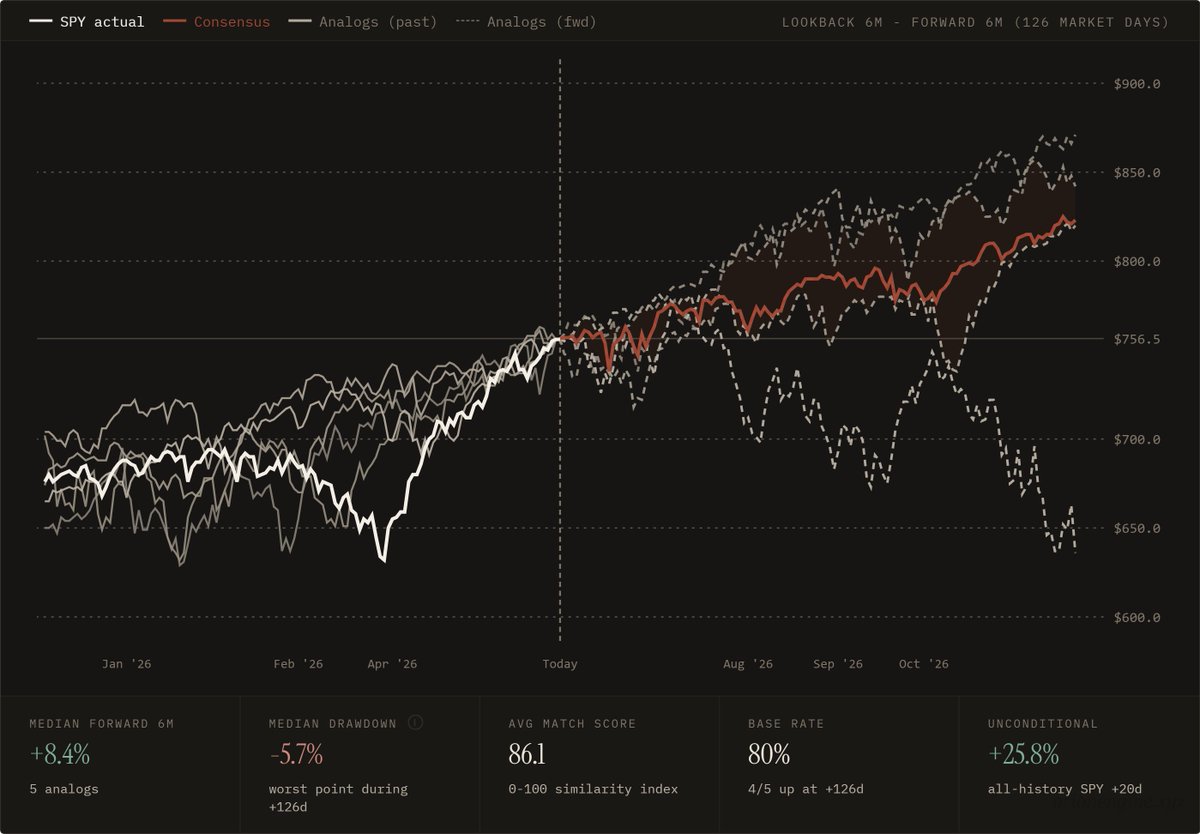
Markets made new all-time highs today, with the S&P 500 having a chance to do something it hasn't done in forty years, which is closing higher for 10 consecutive weeks.
It's already up roughly 10% year-to-date, and the five closest historical analogs over the past six months suggest a period of summer consolidation before the broader uptrend resumes into year-end.
The average price path shows median forward six-month returns of 8.4%, which would place the S&P 500 around 8,200, a target that seemed far-fetched just a couple months ago.
The Takeaway: Historical analogs suggest near-term consolidation is likely before seeing further momentum into year-end.
More Great Charts
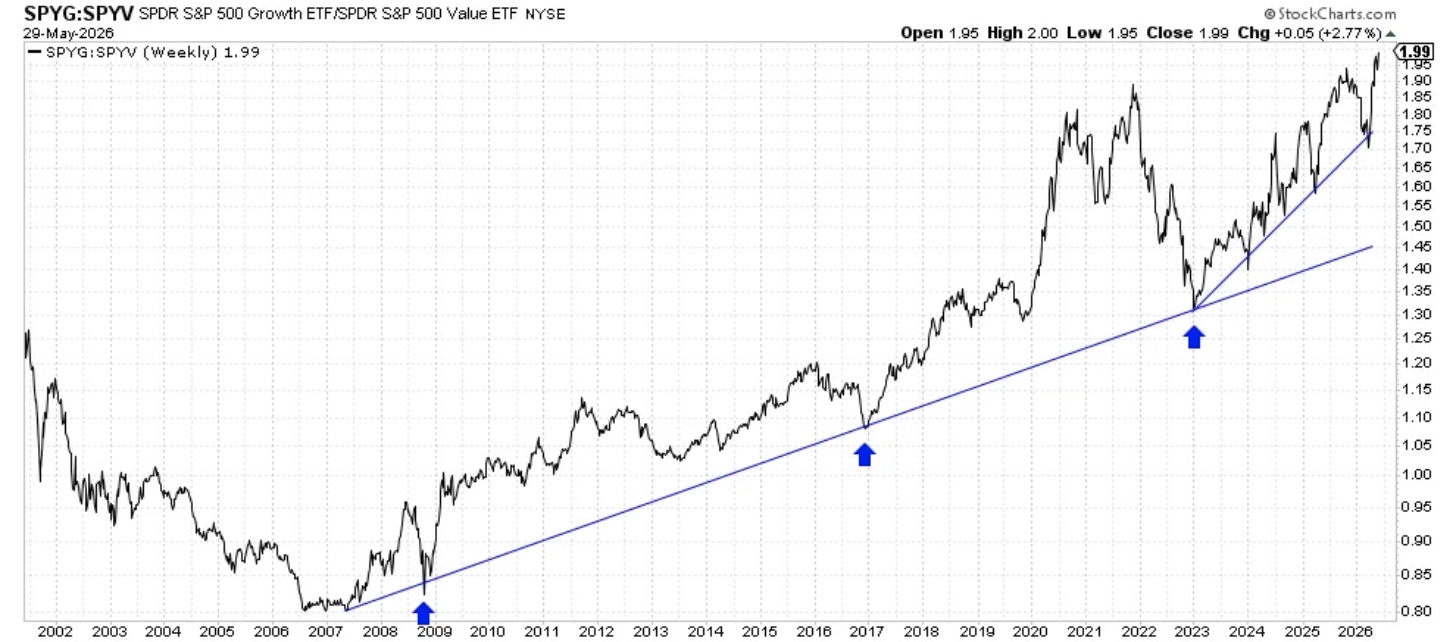
Growth relative to Value closed at new all-time highs.
Check out the full article from Rotational Investing.
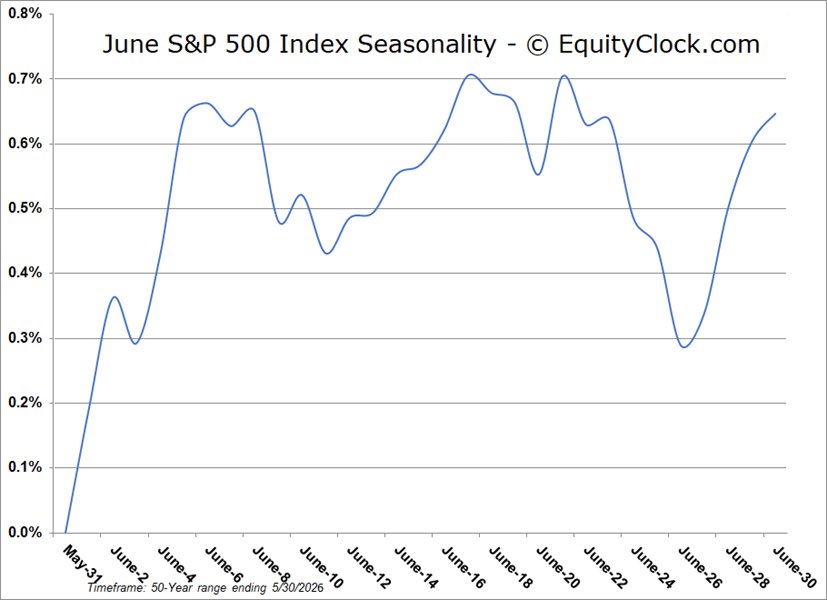
June tends to see a strong first week followed by choppy price action throughout the rest of the month, with the S&P 500 posting an average gain of +0.6%.
See the complete post from EquityClock.
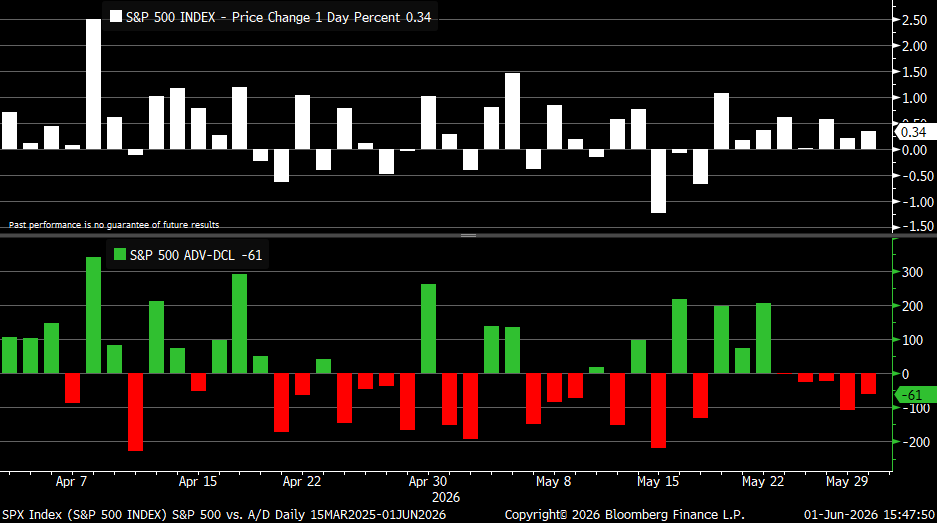
The S&P 500 has pushed higher for five-straight days, even as more stocks declined than advanced in each session.
View the entire tweet from Kevin Gordon.
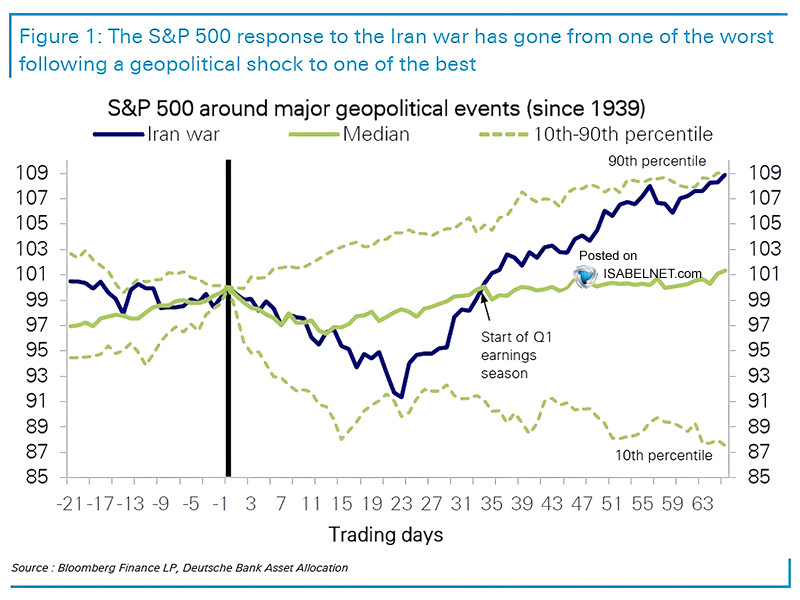
The S&P 500's response to Middle East tensions has evolved from one of the weakest on record to one of the strongest following a geopolitical shock.
Examine the whole post from Isabelnet via Deutsche Bank.
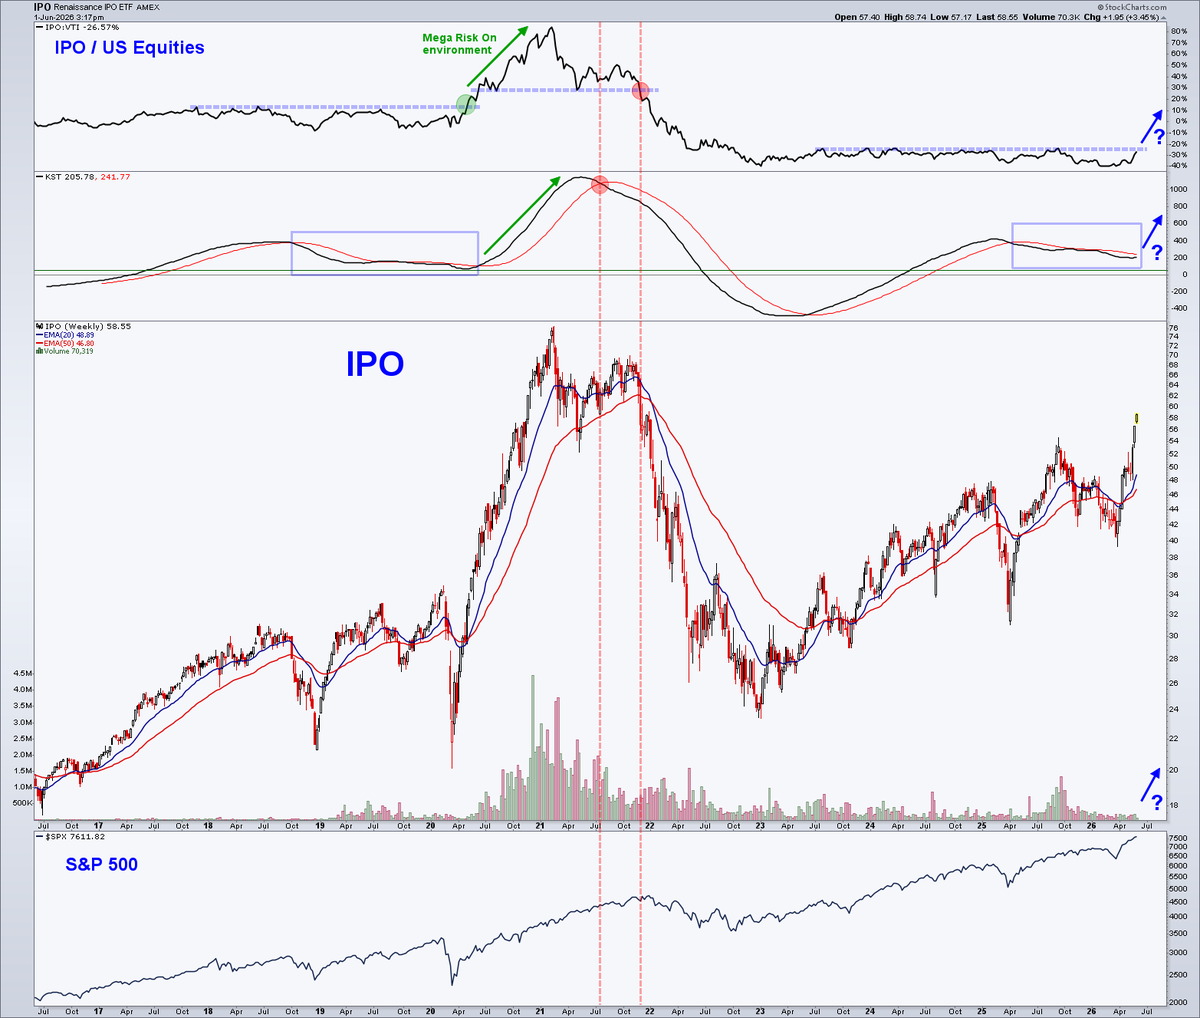
New multi-year highs in the IPO Index are being accompanied by a potential relative strength breakout against the S&P 500.
See the entire tweet from Jim Knarr.
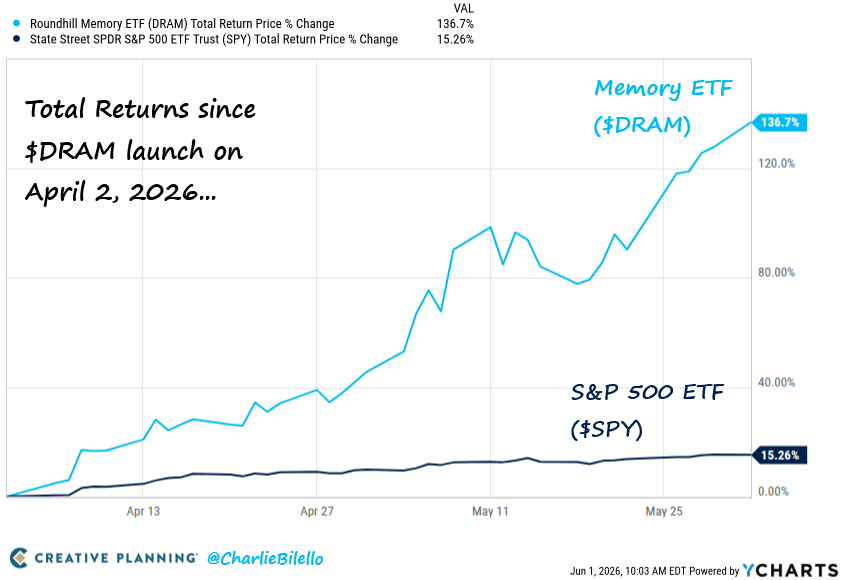
Since launching on April 2, the Roundhill Memory ETF has surged more than 135% year-to-date.
Check out the full market video from Charlie Bilello.
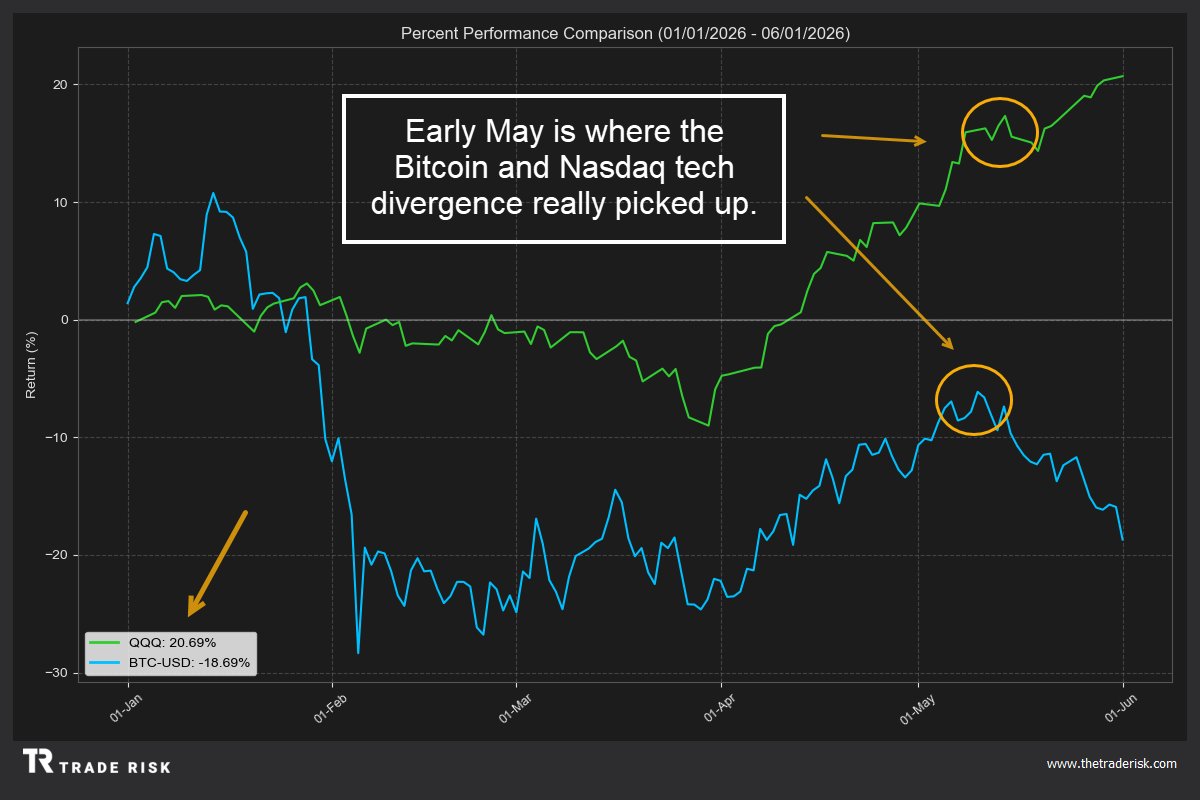
Bitcoin began diverging from the Nasdaq in early May.
View the whole tweet from Evan Medeiros.
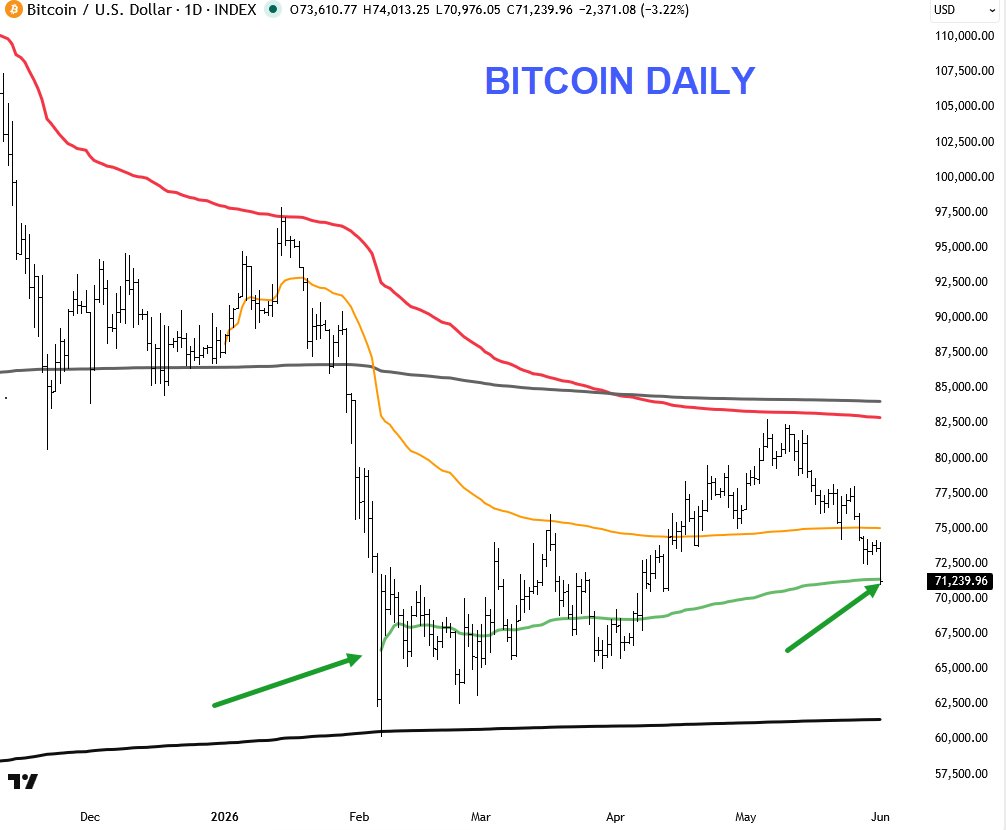
Bitcoin has pulled back to its VWAP anchored from the February lows.
See the complete post from Brian Shannon.
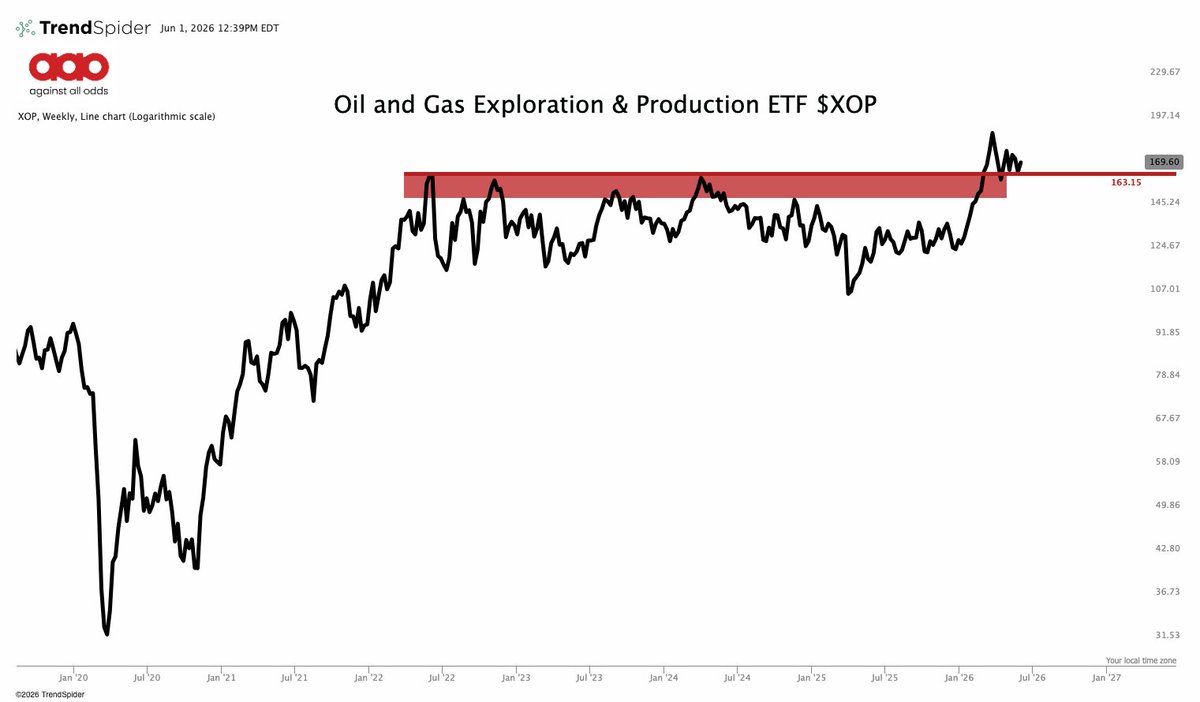
The Oil and Gas Exploration & Production ETF is tightly coiled just above its prior highs.
Examine the full tweet from Jason Perz.
The Chart Report curates best-in-class technical analysis from across the web.
If you’d like to share a chart or just say hello, email us at [email protected]