The Median Stock Is Breaking Out 📈 The Chart Report

Chart of the Day
🏆 Today's Chart of the Day was shared by Ricardo Sarraf.

The Value Line Geometric Index (VALUG) broke through its multi-month resistance level today and closed at fresh four-year highs.
This breakout undermines the narrow breadth narrative, as VALUG is widely viewed as a gauge of the median stock's performance.
A breakout to new highs in this important breadth measure suggests market participation is expanding, further supported by recent record highs in the Equal Weight S&P 500, Nasdaq, and Dow.
The Takeaway: The median stock is finally joining the party.
More Great Charts
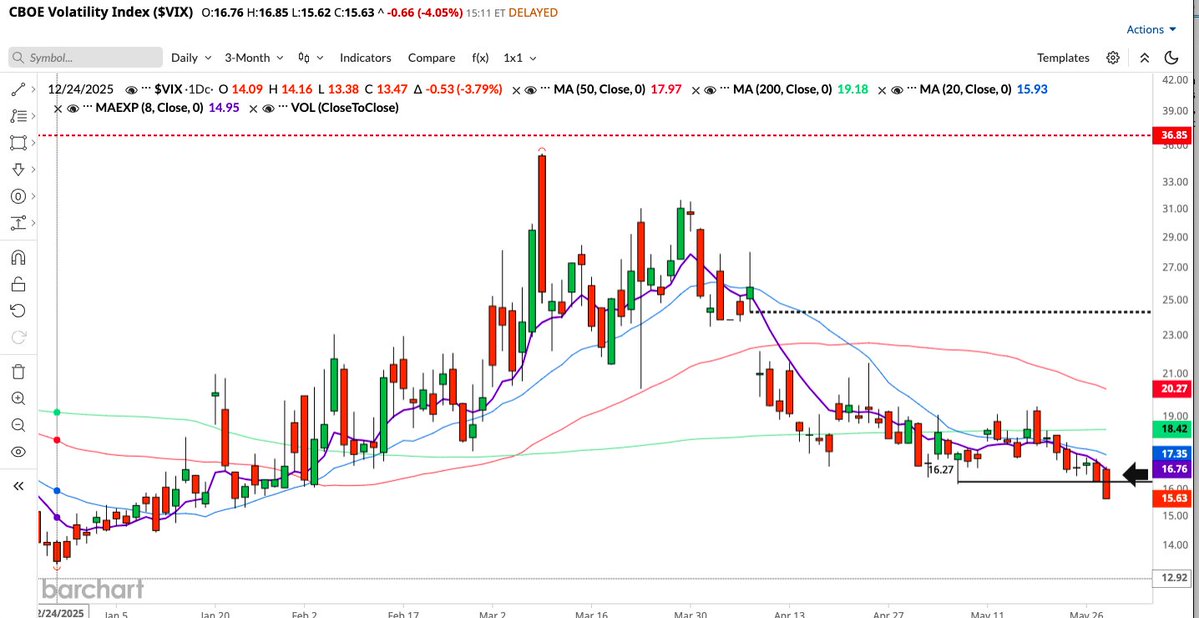
The VIX is breaking down to new 5-month lows.
View the full tweet from Stacey Lee.
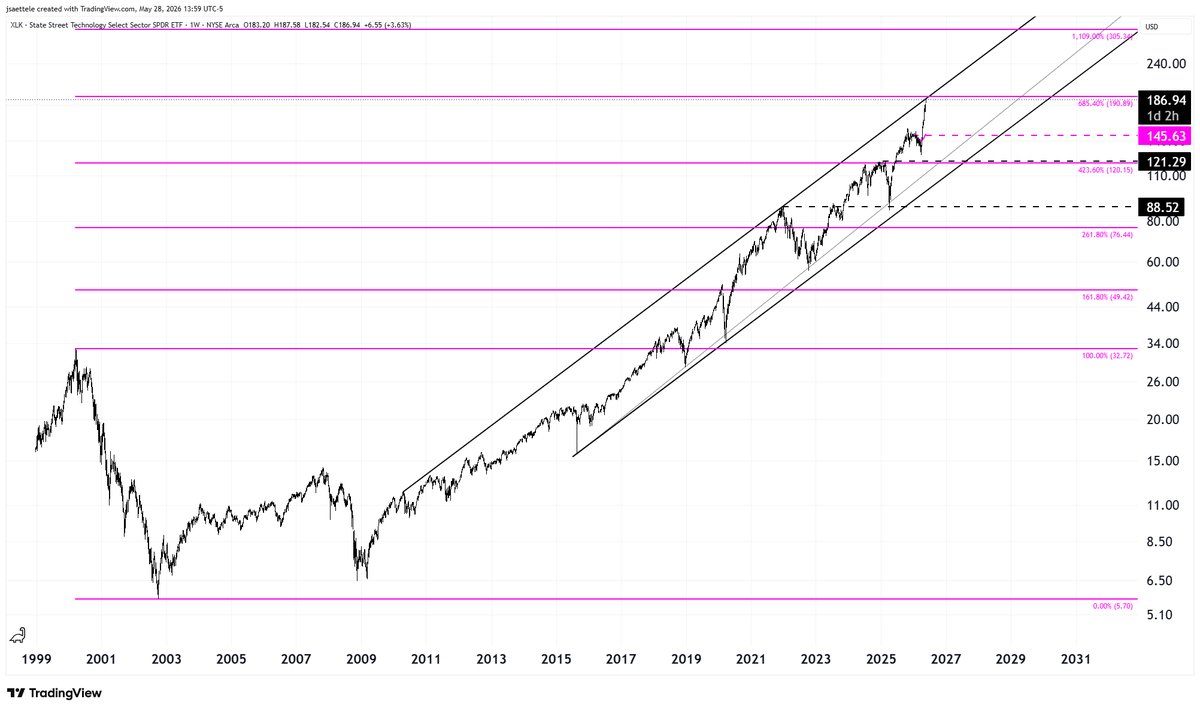
The Technology sector (XLK) has run into the upper boundary of its long term channel and the 4th Fibonacci extension (685.4%) from the 2000-2002 decline.
See the whole post from Jamie Saettele.
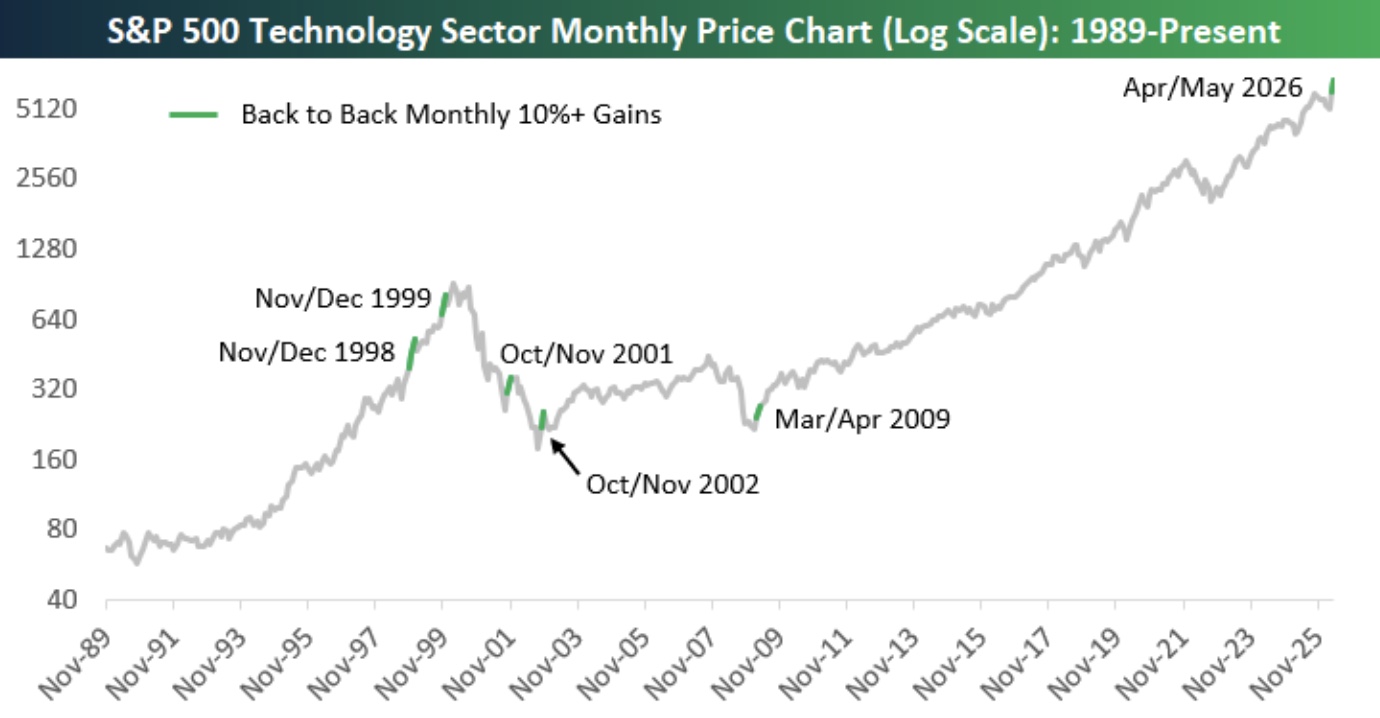
Technology stocks surged more than 17% in April and are up another 12% in May, marking the strongest two-month stretch since the Great Financial Crisis bottom.
Read the complete note from Bespoke.
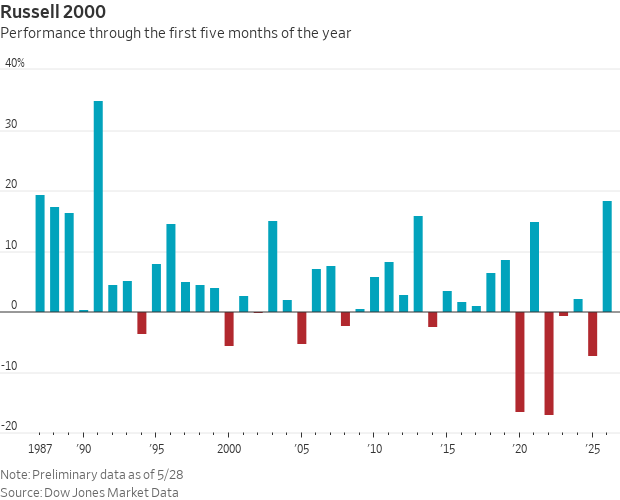
The Russell 2000 (IWM) is on track for its strongest start to a year since 1991.
Check out the entire tweet from Josh Schafer.
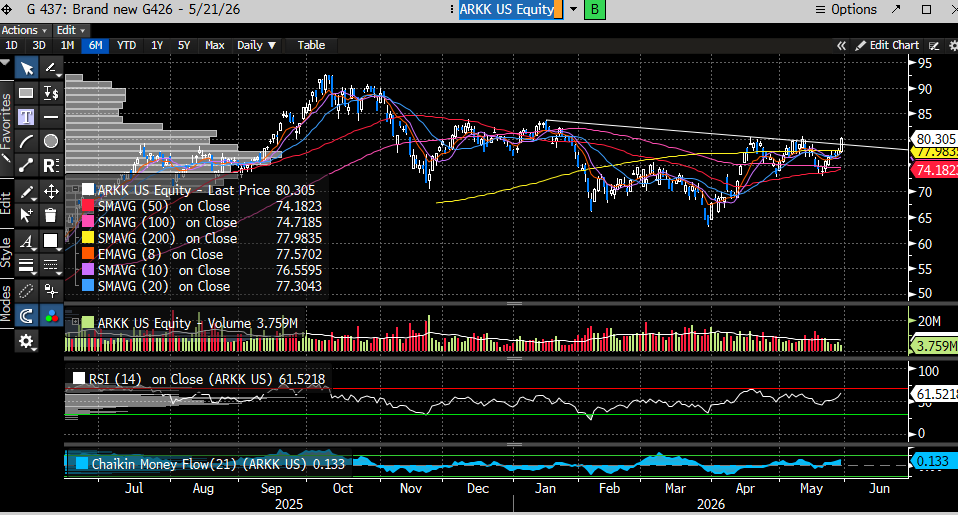
ARKK Innovation (ARKK) is breaking out of its downward trendline.
Examine the full post from CoiledSpringCapital.
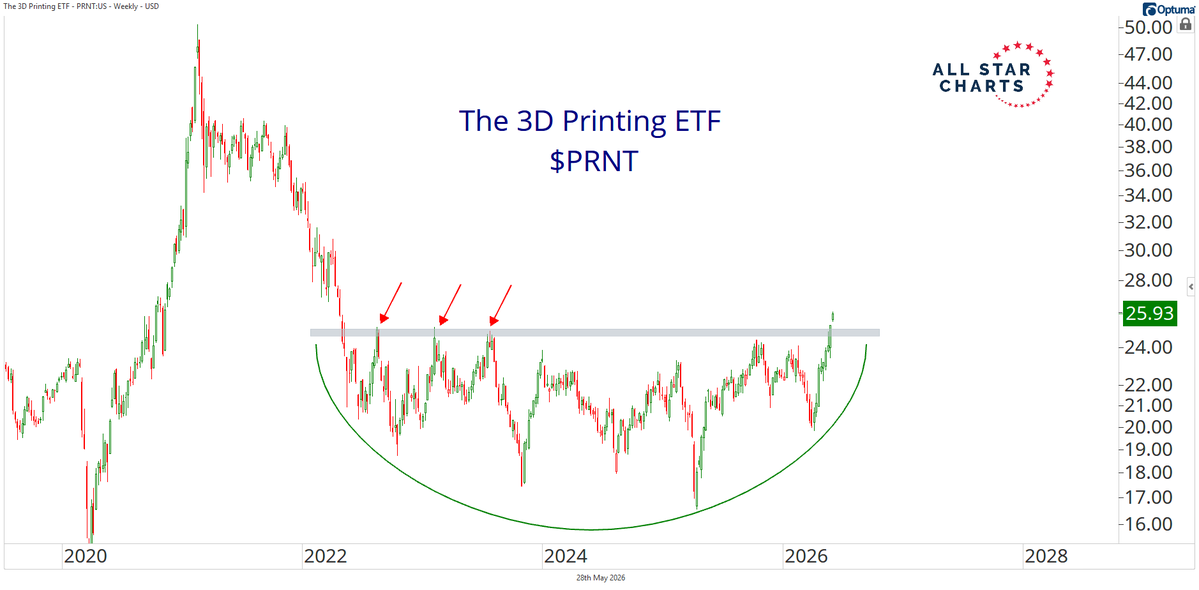
The 3D Printing ETF (PRNT) is resolving higher from its multi-year base.
See the whole tweet from Alfonso De Pablos.
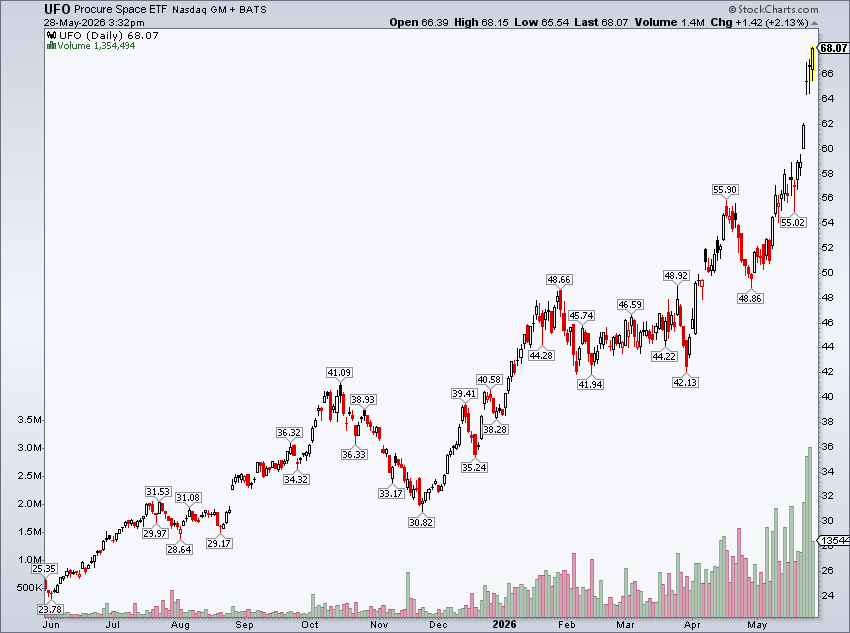
Space stocks (UFO) continue to soar to new record highs.
Read the complete article from Mike Zaccardi.
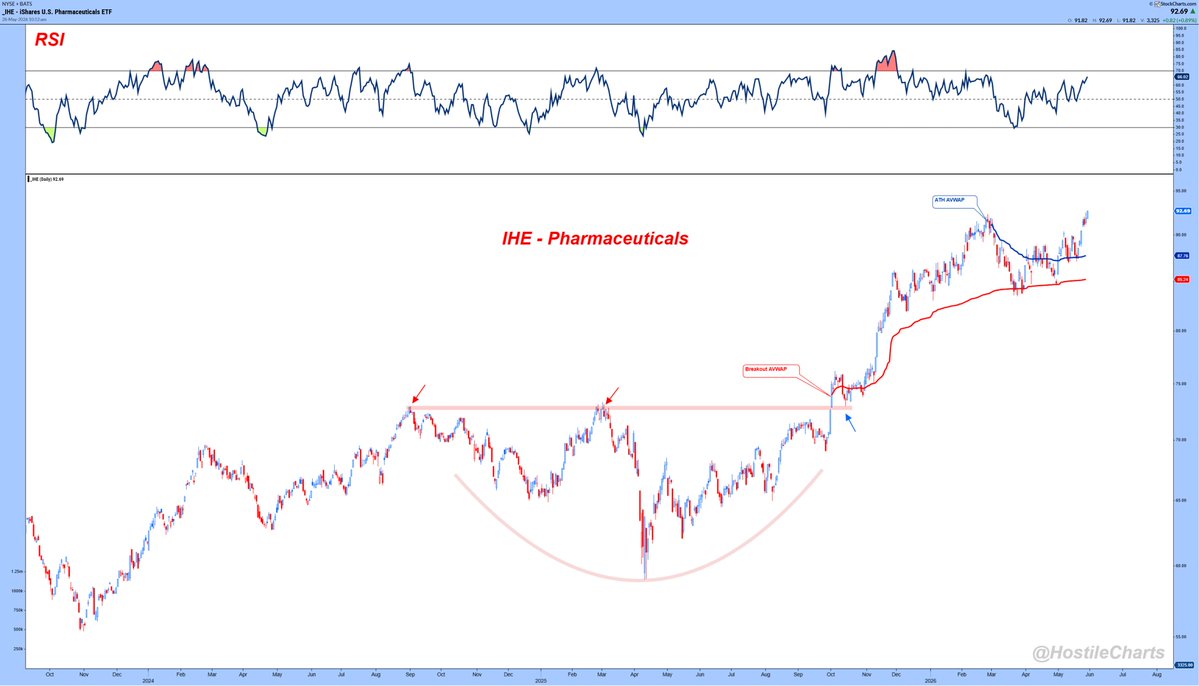
The Pharmaceuticals ETF (IHE) is making new all-time highs.
View the entire tweet from Larry Thompson.
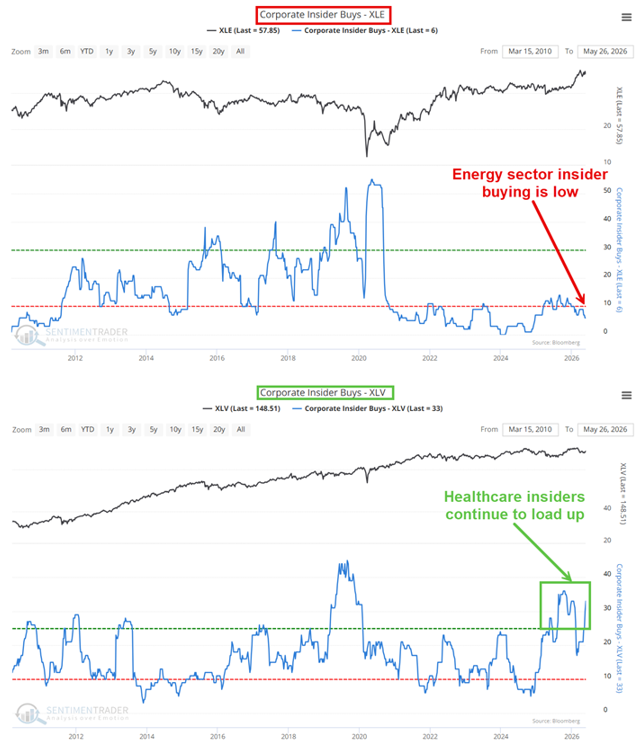
Corporate insiders are selling Energy stocks while increasing exposure to Healthcare.
Check out the full post from Jay Kaeppel.
The Chart Report curates best-in-class technical analysis from across the web.
If you’d like to share a chart or just say hello, email us at [email protected]