Software’s Historic Seven-Week Stretch 📈 The Chart Report

Chart of the Day
🏆 Today's Chart of the Day was shared by Stacey Lee.
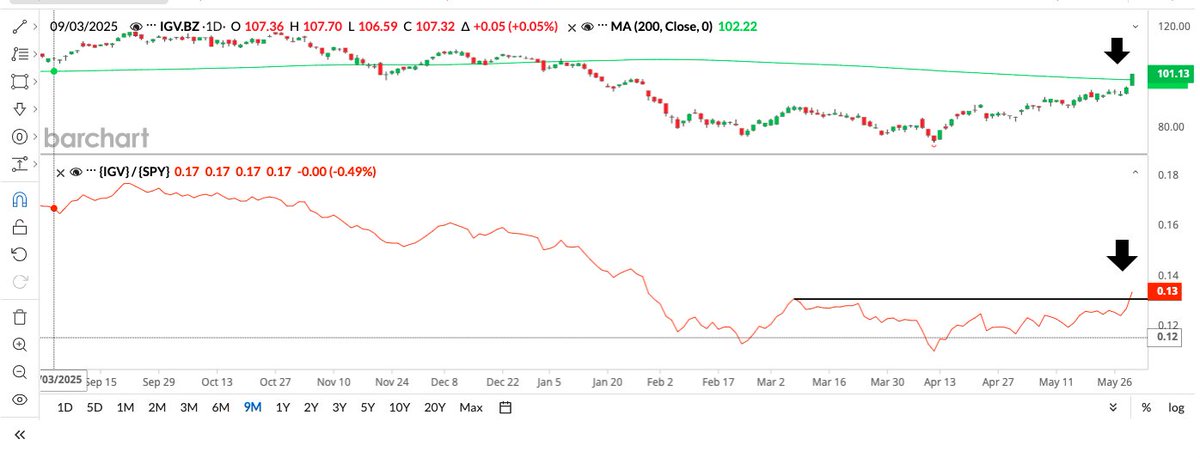
The Software ETF (IGV) just posted its best single-day gain in over a year and closed higher for a seventh consecutive week.
IGV has rallied more than 36% during that span, marking its second strongest seven-week advance on record, trailing only the rebound off the post-dot-com lows.
Software also reclaimed its long-term 200-day moving average, and combined with a relative breakout versus the S&P 500, the beaten-down group looks ready to lead again.
The Takeaway: The combination of momentum and relative strength points to a durable trend shift in software.
More Great Charts
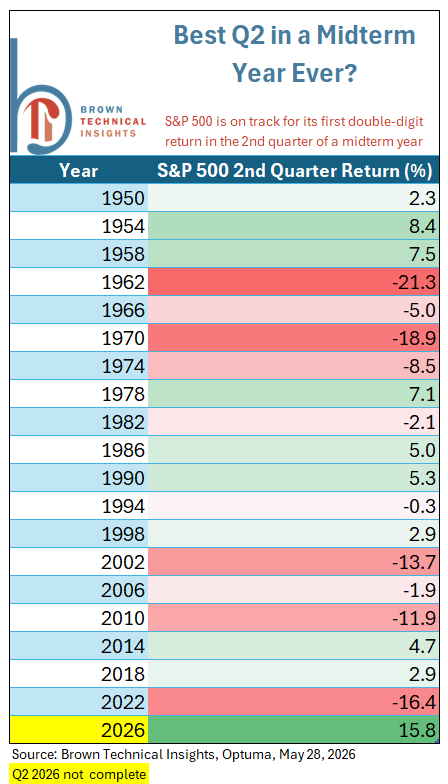
The S&P 500 is tracking toward its best Q2 of any midterm year ever.
View the full tweet from Scott Brown.
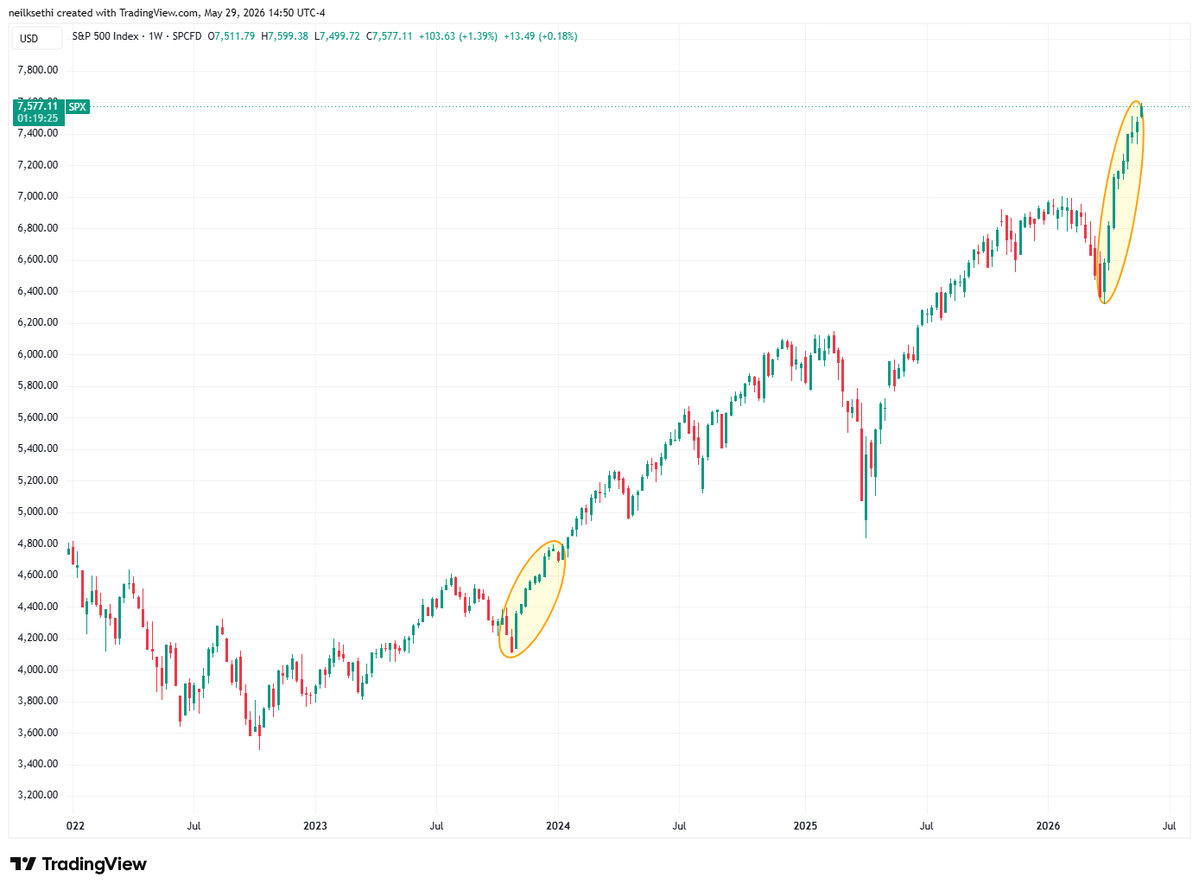
The S&P 500 has rallied for nine-straight weeks, matching its longest winning streak since 1985.
See the whole post from Neil Sethi.
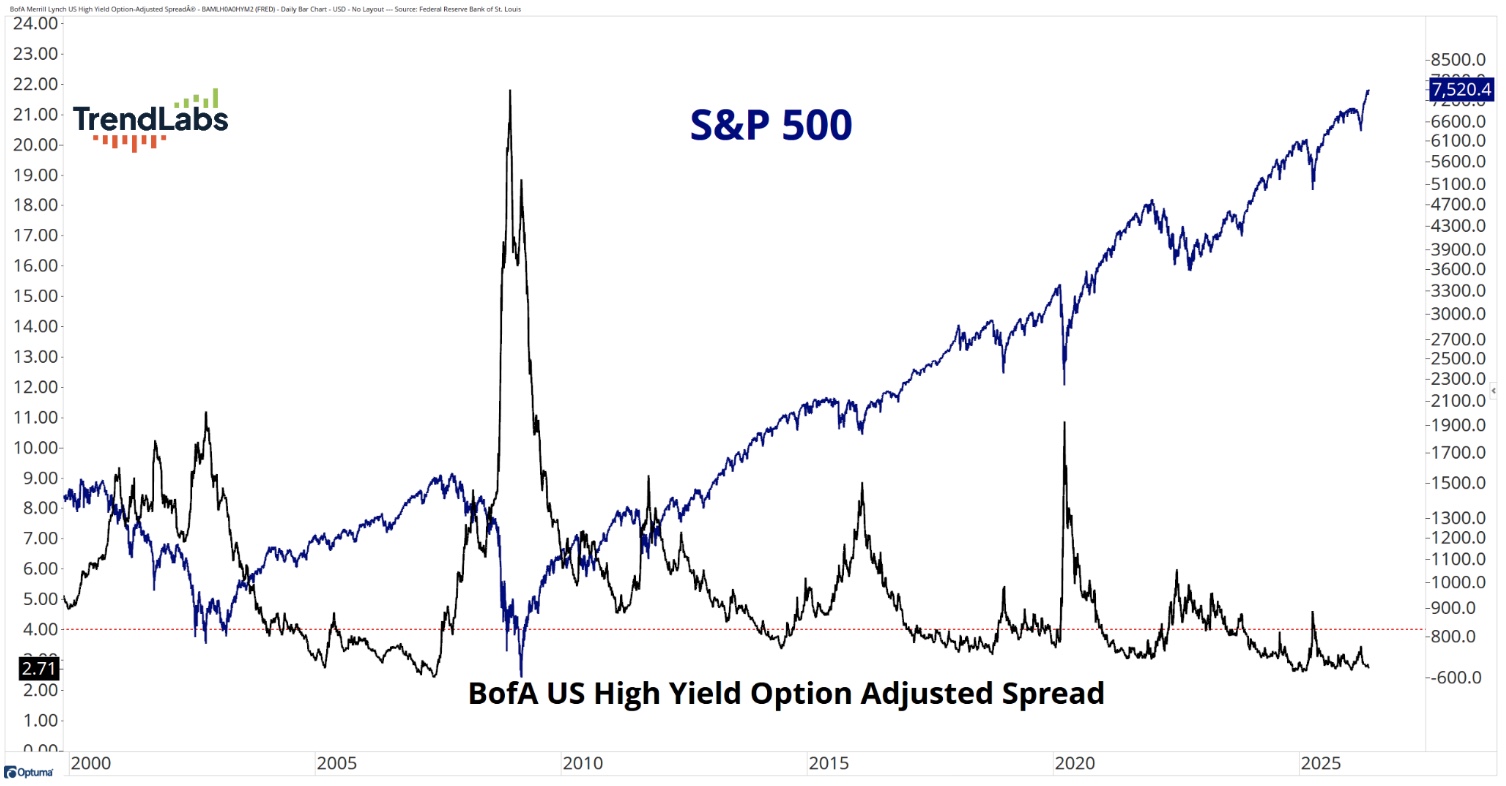
Credit spreads remain near the low end of their historical range, signaling little evidence of stress beneath the surface.
Read the complete analysis from Grant Hawkridge.
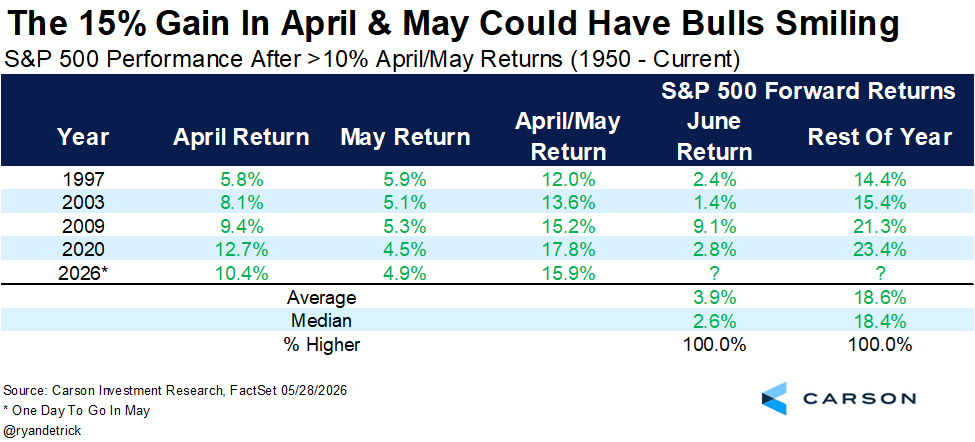
When April and May both gain more than 10%, the S&P 500 has gone on to post double-digit gains for the rest of the year with average gains of nearly 19%.
View the entire tweet from Ryan Detrick.
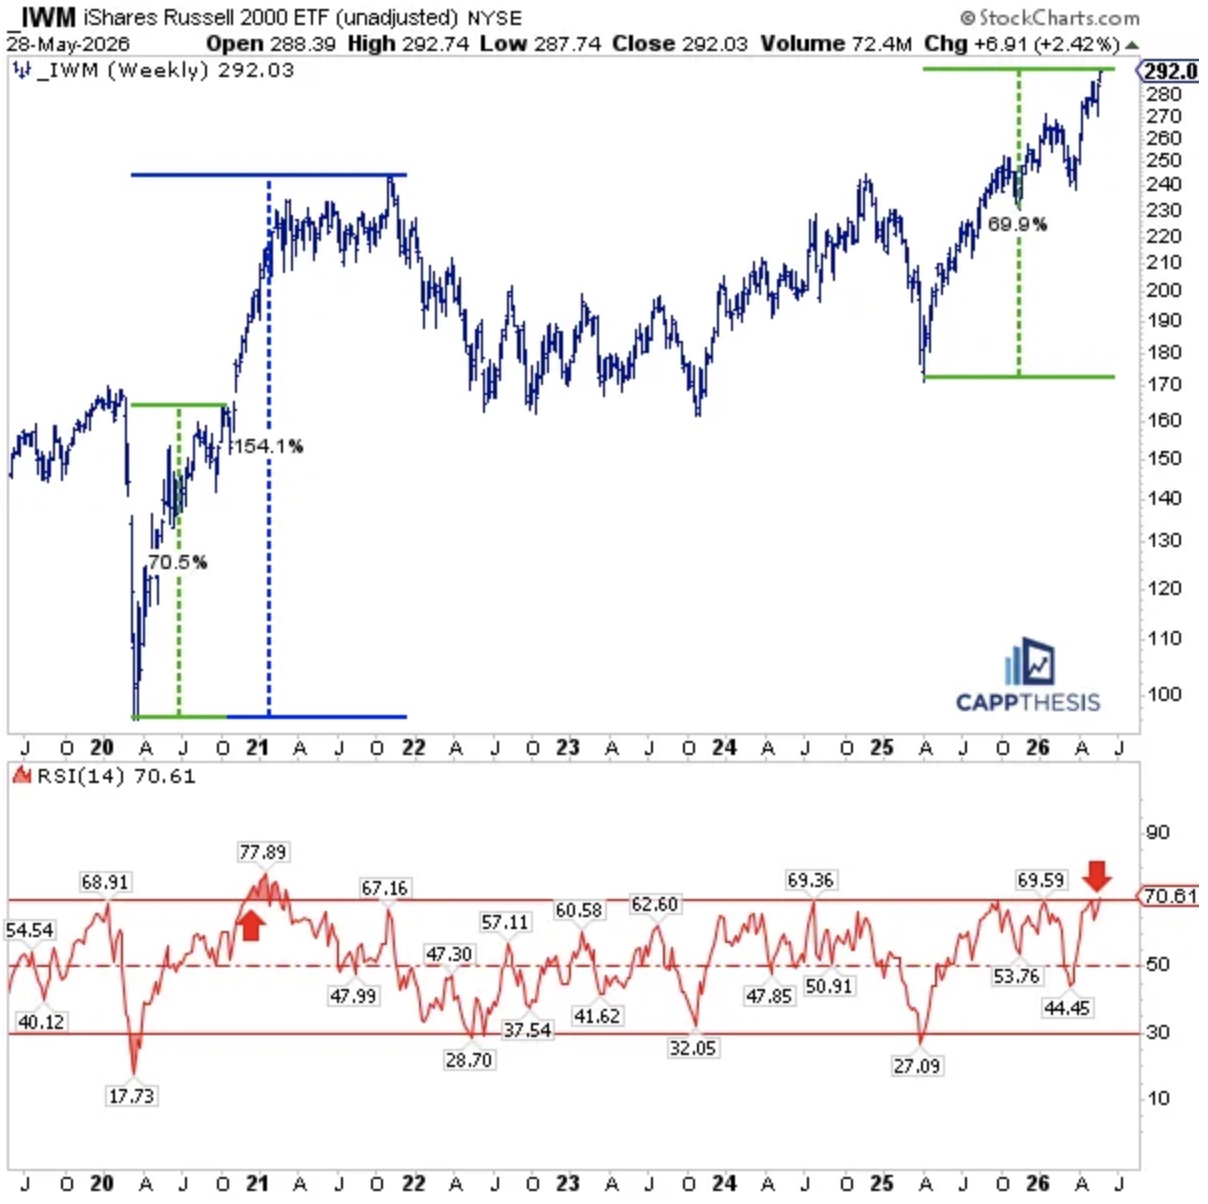
IWM has surged roughly 70% off its 2025 lows and has now re-entered weekly overbought territory.
Read the full article from Frank Cappelleri.
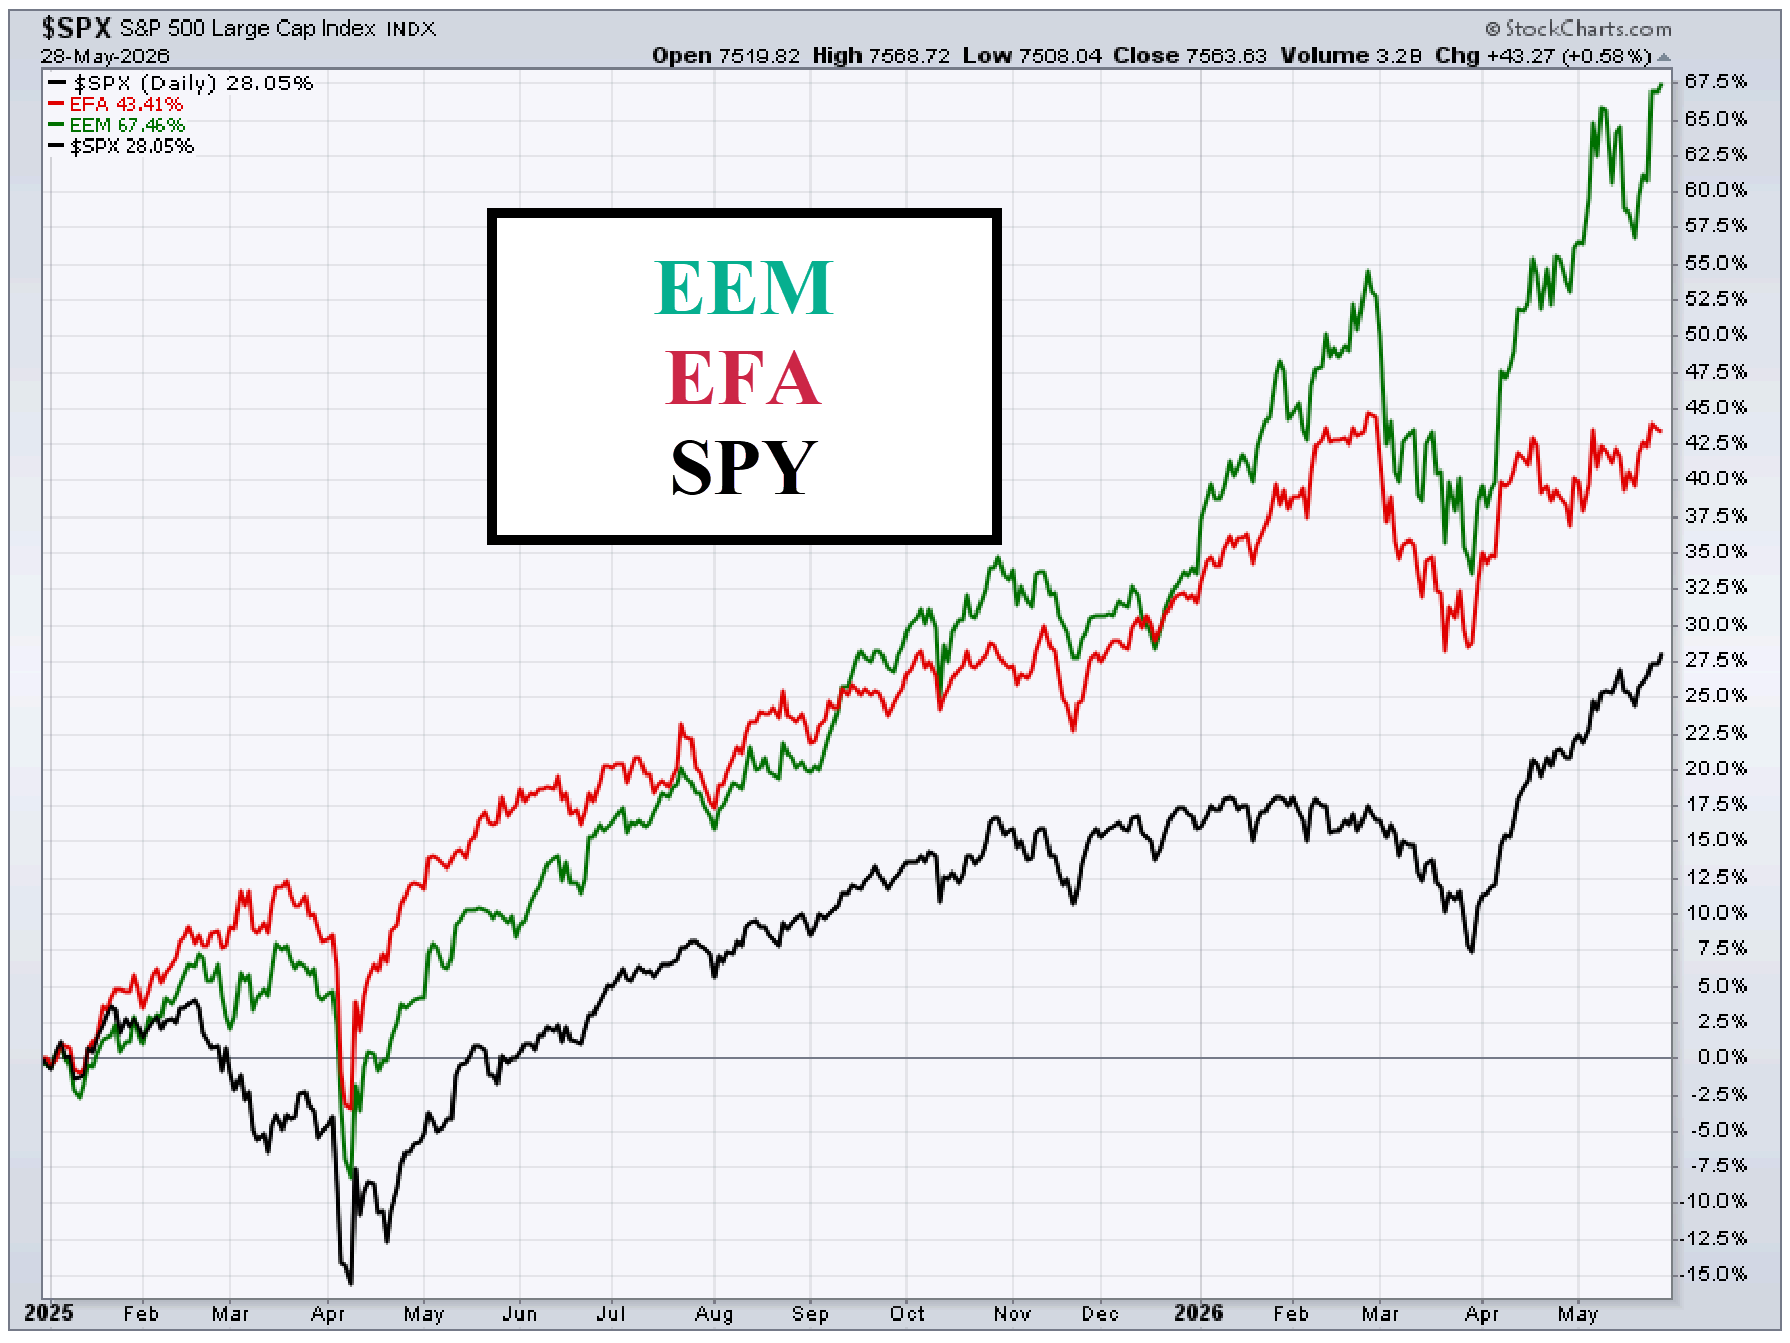
Emerging Markets (EEM) outperformed U.S. stocks last year and are extending that leadership again this year.
Check out the whole tweet from Jim Carroll.
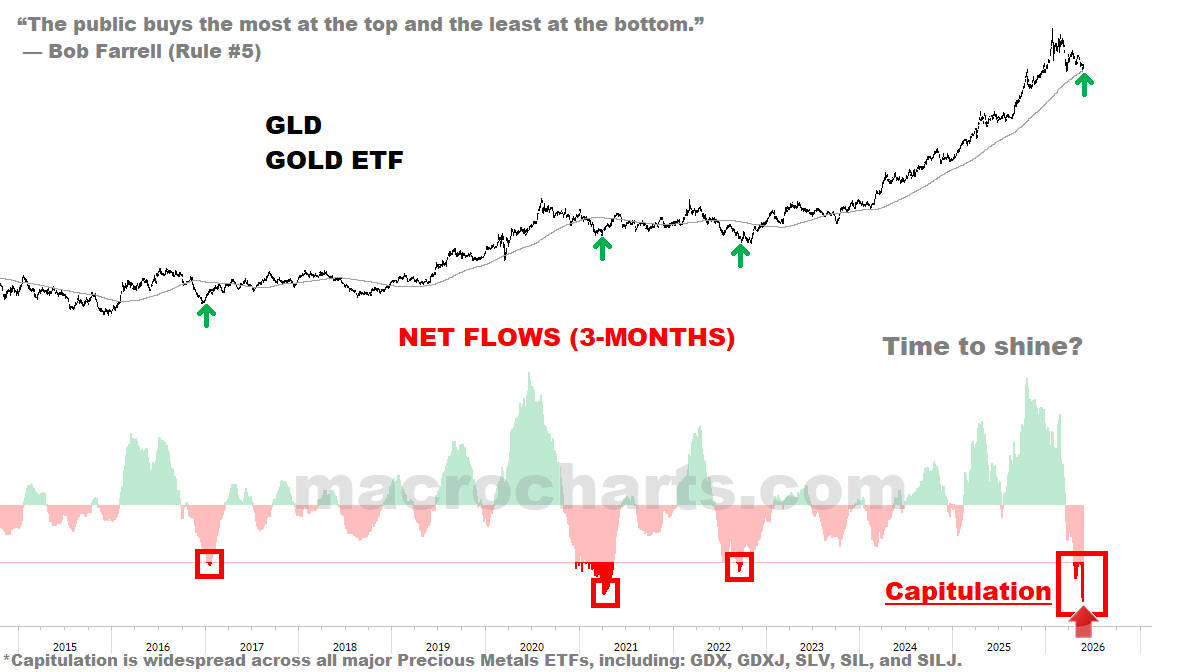
Rolling 3-month inflows into the Gold ETF (GLD) have reached levels that have historically aligned with major lows.
See the complete post from MacroCharts.
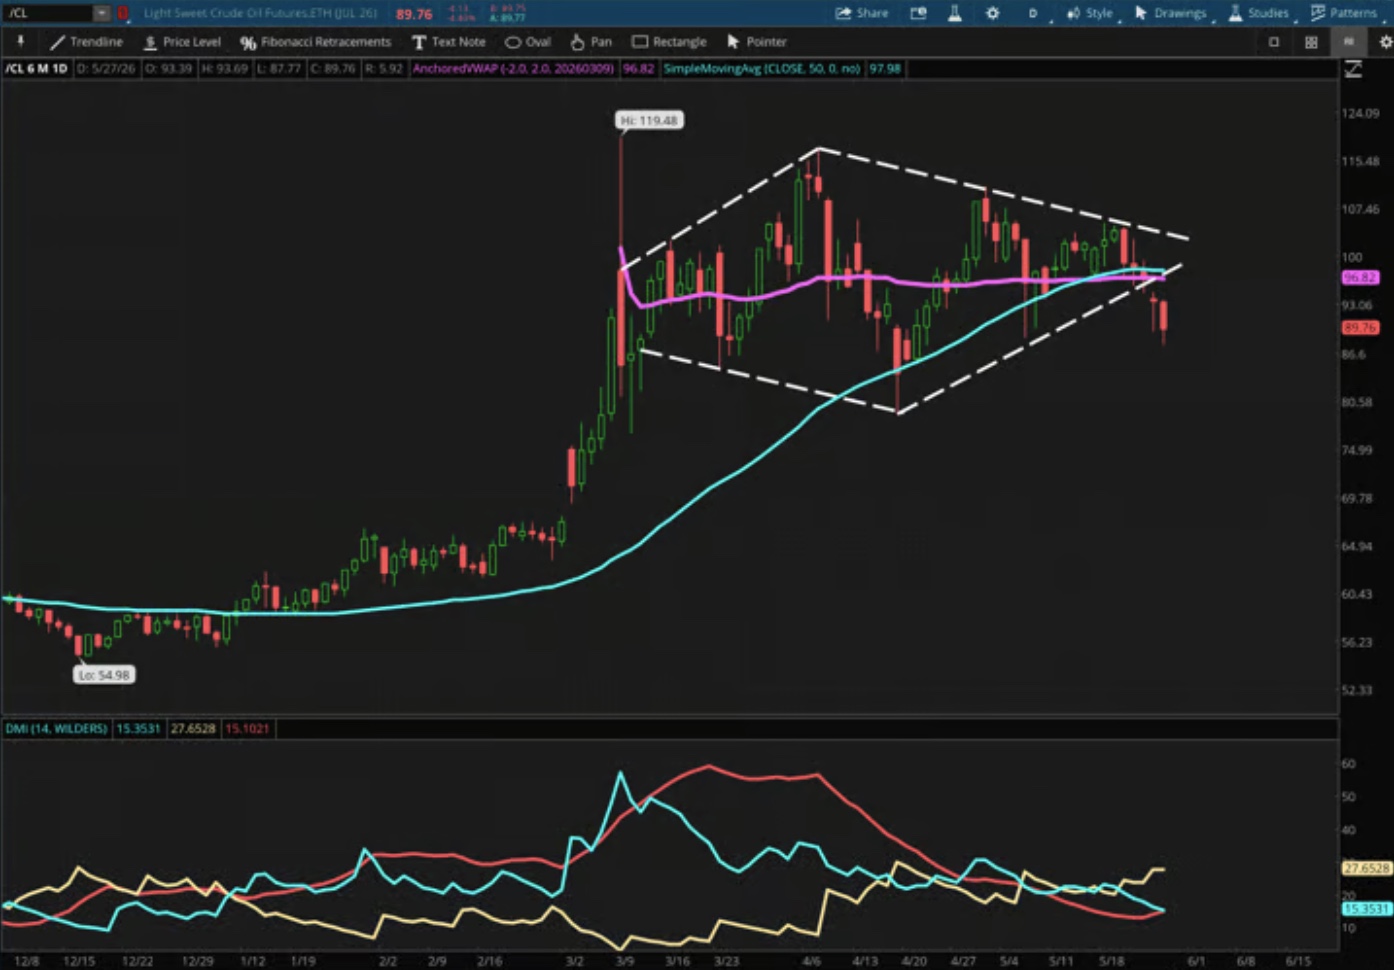
Crude Oil is breaking down from a diamond-top pattern.
Read the full analysis from Rachel Dashiell.
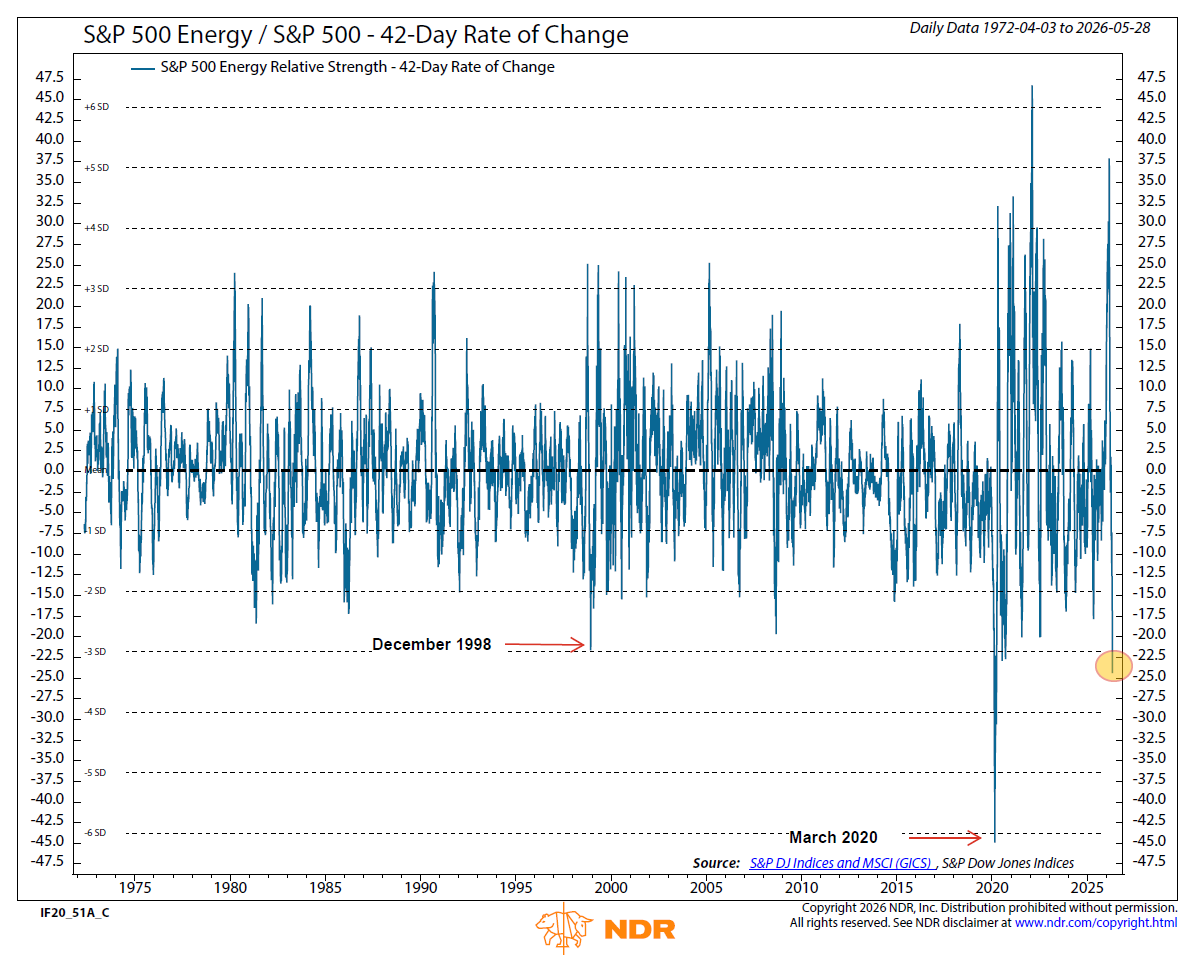
Energy stocks have logged their second worst rolling two‑month stretch on record versus the S&P 500.
View the entire tweet from Rob Anderson.
The Chart Report curates best-in-class technical analysis from across the web.
If you’d like to share a chart or just say hello, email us at [email protected]