A Relief Rally is Underway, But the Path Forward Remains Unclear 📈 The Chart Report

Chart of the Day
🏆 Today's Chart of the Day was shared by Frank Cappelleri.
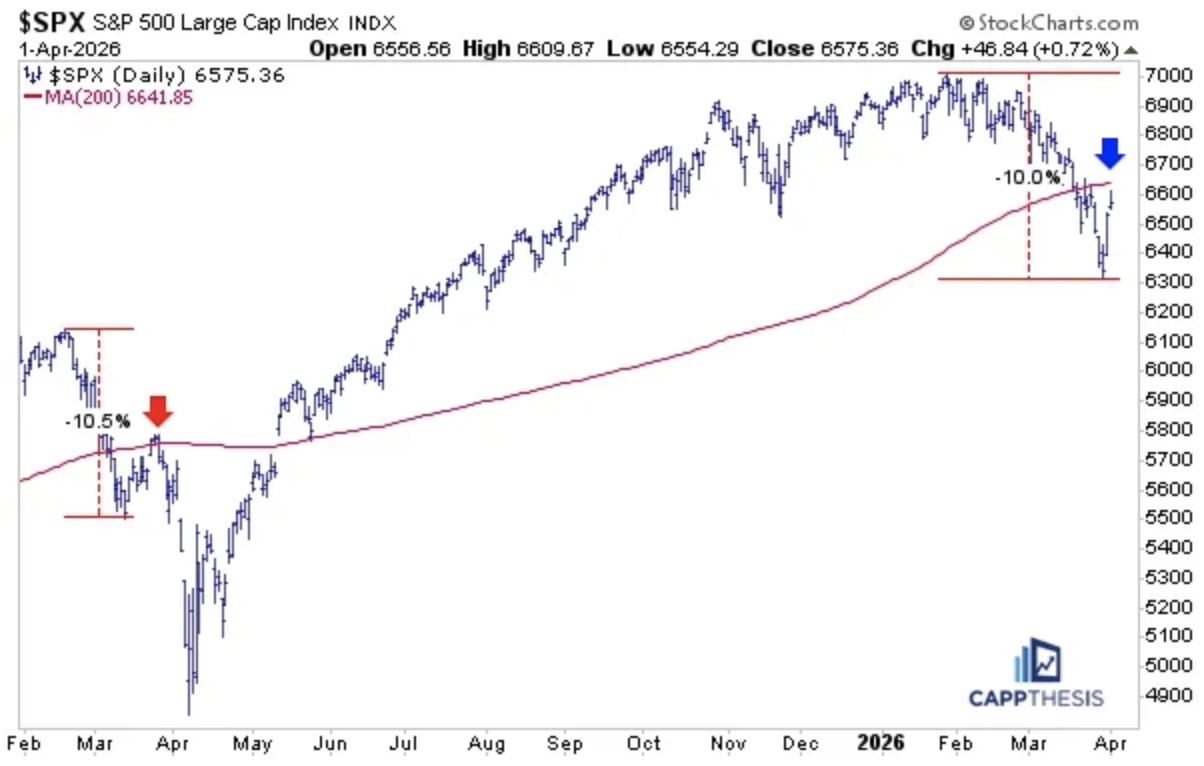
The S&P 500 has rallied roughly +4% off Monday’s lows, closing the week higher and snapping a five-week losing streak.
A similar pattern unfolded last year, when a -10% decline was followed by a short-lived counter-trend rally, and then an additional -15% drop.
The key question now is whether the S&P can hold on the next round of profit-taking, form a higher low, and signal that a durable bottom may be taking shape.
The Takeaway: We’ve seen a bounce, but it’s too soon to be confident a structural low is set.
More Great Charts
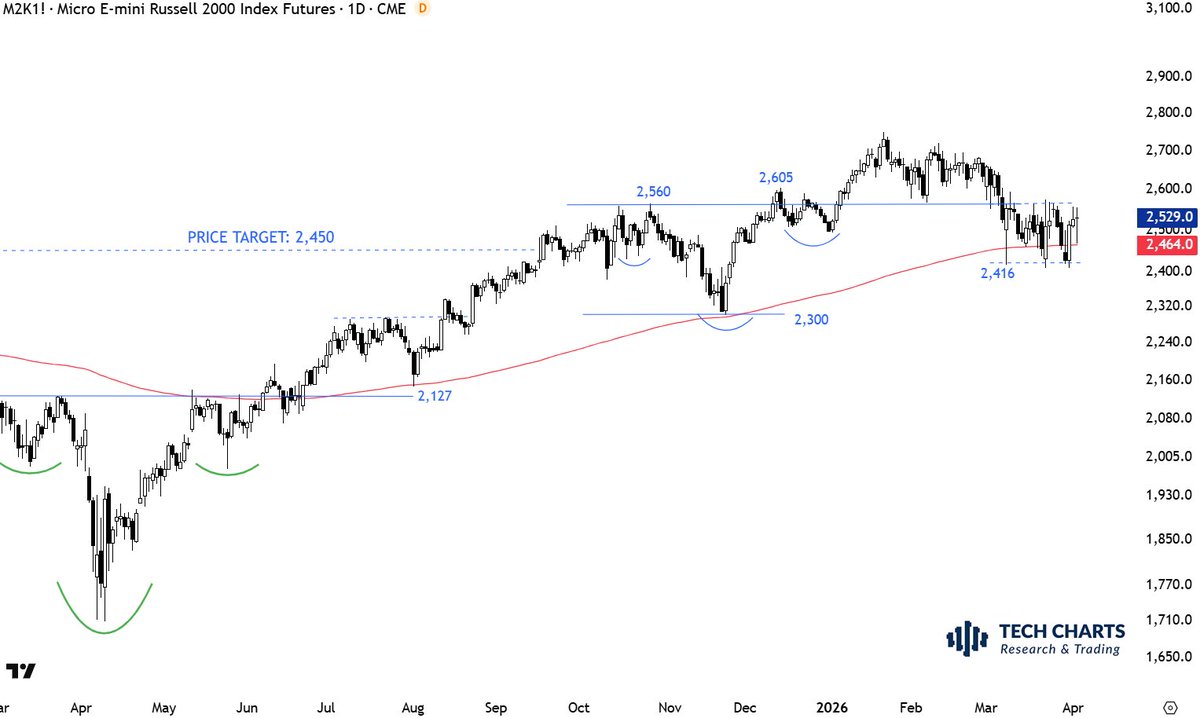
The tight consolidation in the Russell 2000 suggests momentum is being built for a directional move.
See the whole post from Aksel Kibar.
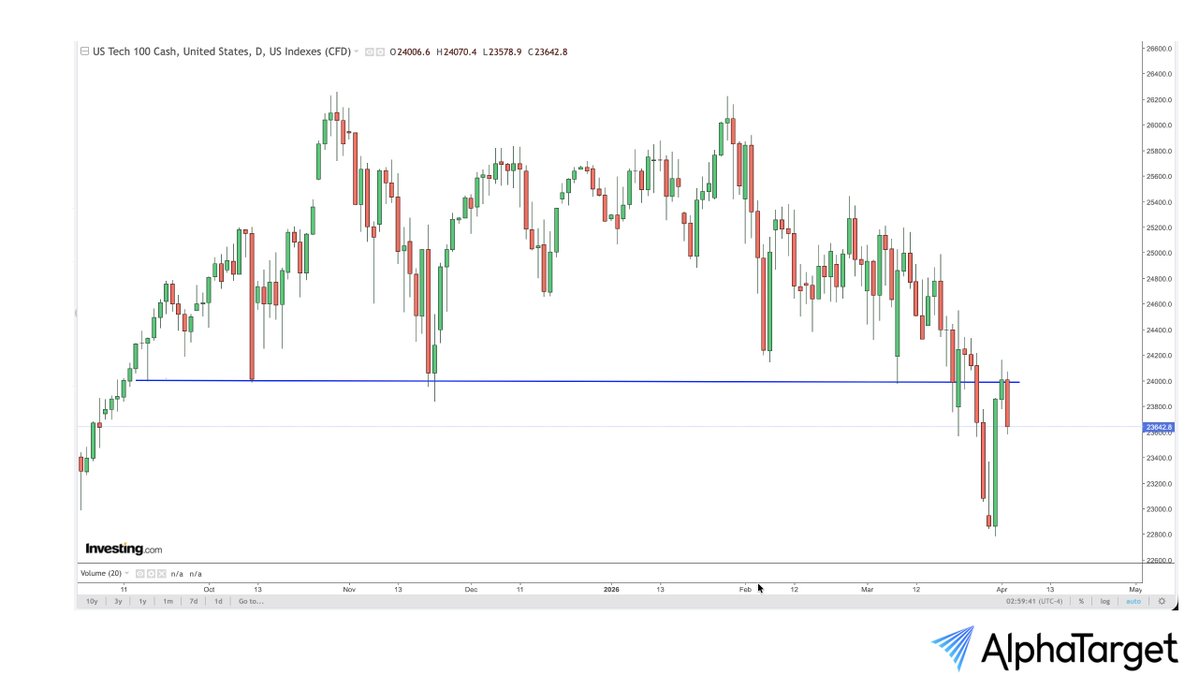
The Nasdaq has found resistance at previous support, a textbook polarity flip.
View the entire tweet from Puru Saxena.
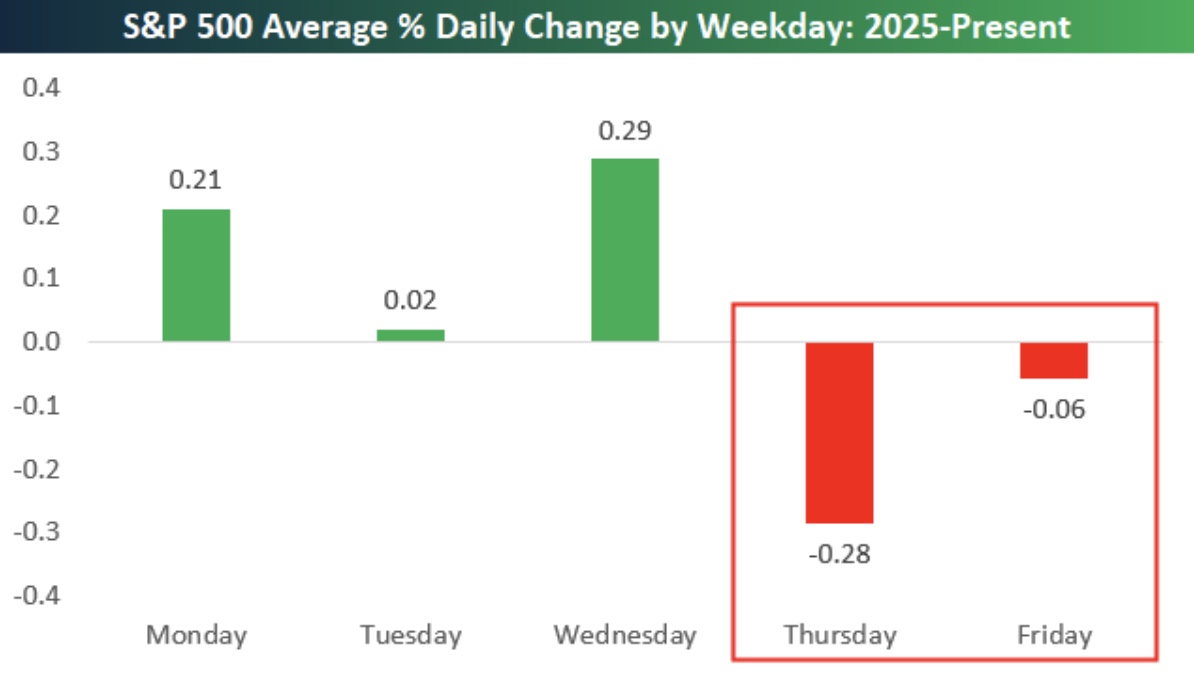
Since the start of 2025, Thursday has by far been the worst day of the week.
Read the full article from Bespoke.
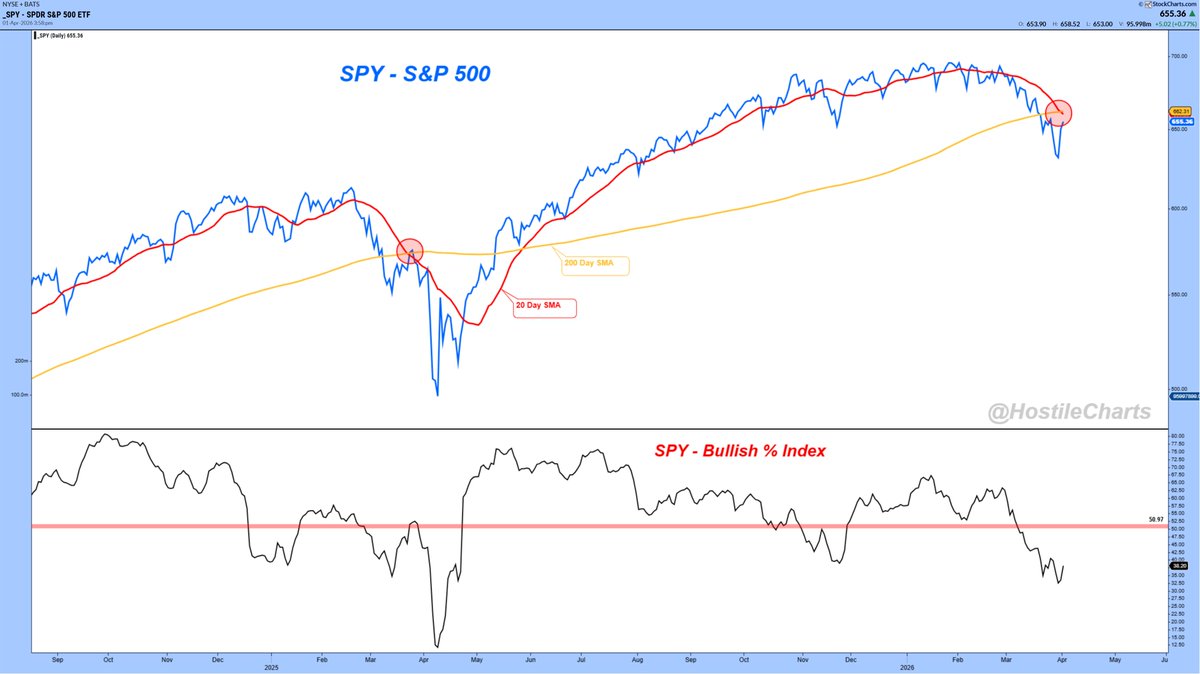
The 20-day moving average crossing below the 200-day moving average is a simple downtrend confirmation technique.
Check out the full post from Larry Thompson.
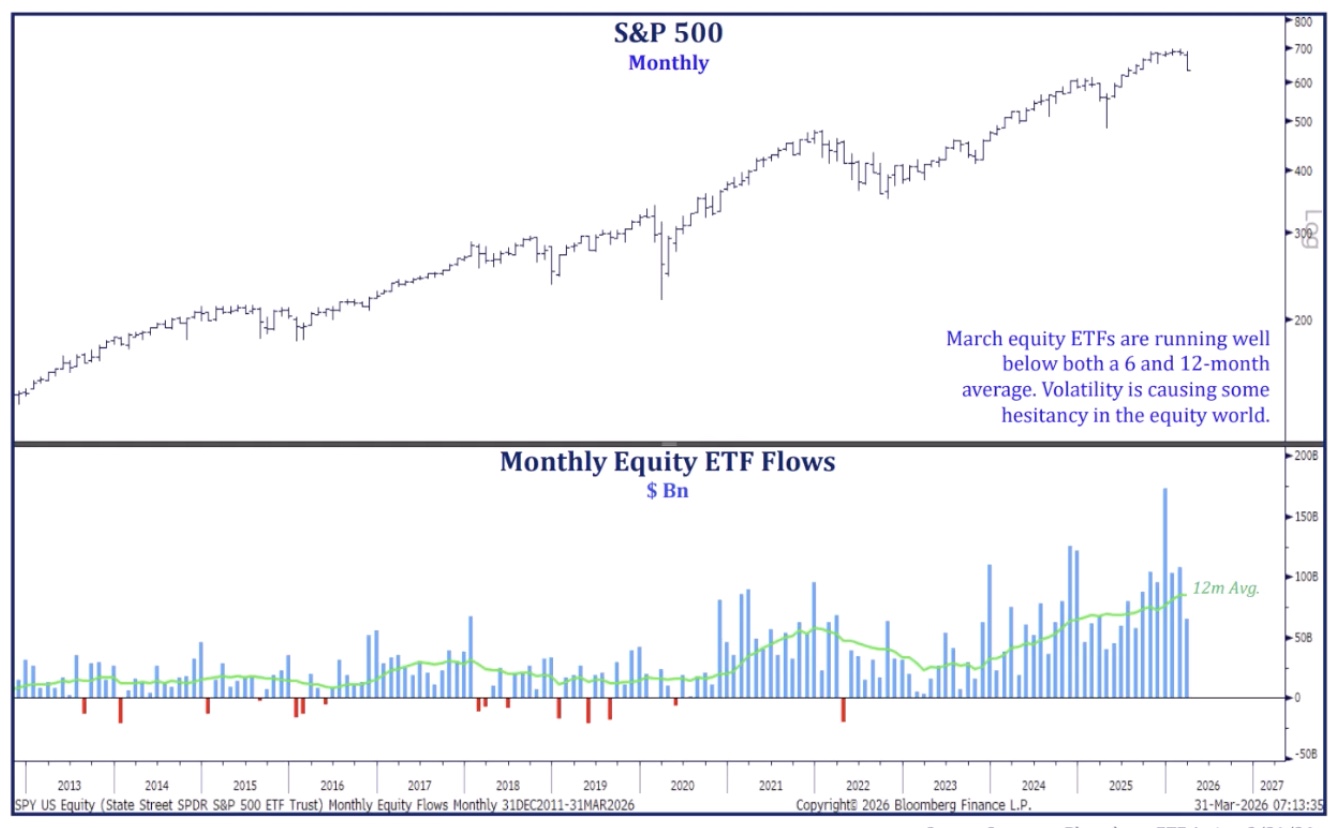
Equity ETF inflows are well below the 12-month average, as recent volatility has caused some hesitancy.
Watch the complete breakdown from Todd Sohn.
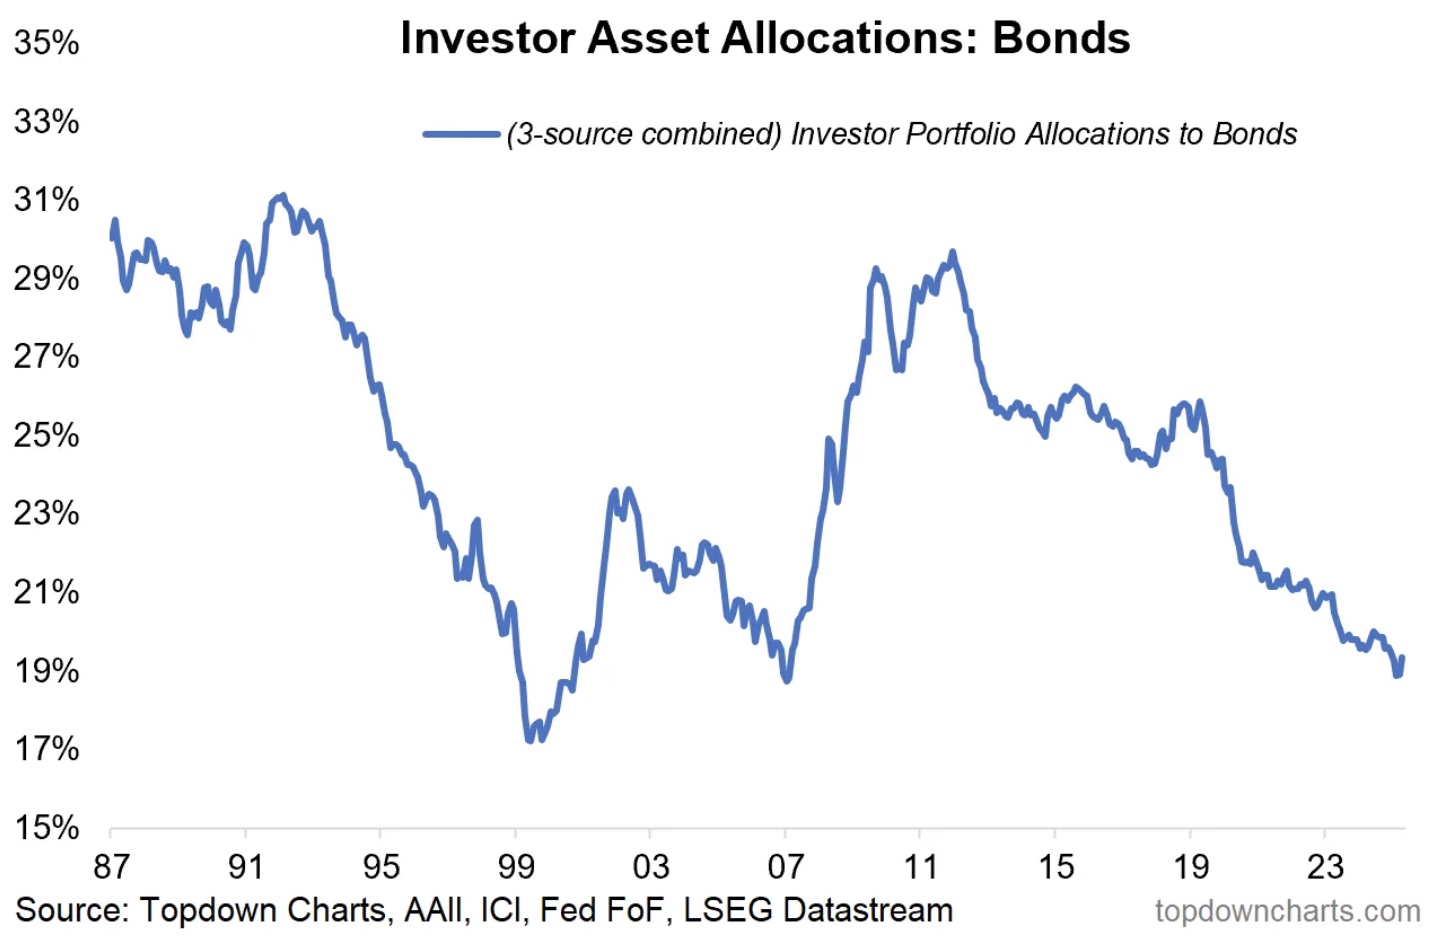
Investor allocations to bonds is near the lowest levels on record.
Explore the latest article from Callum Thomas.
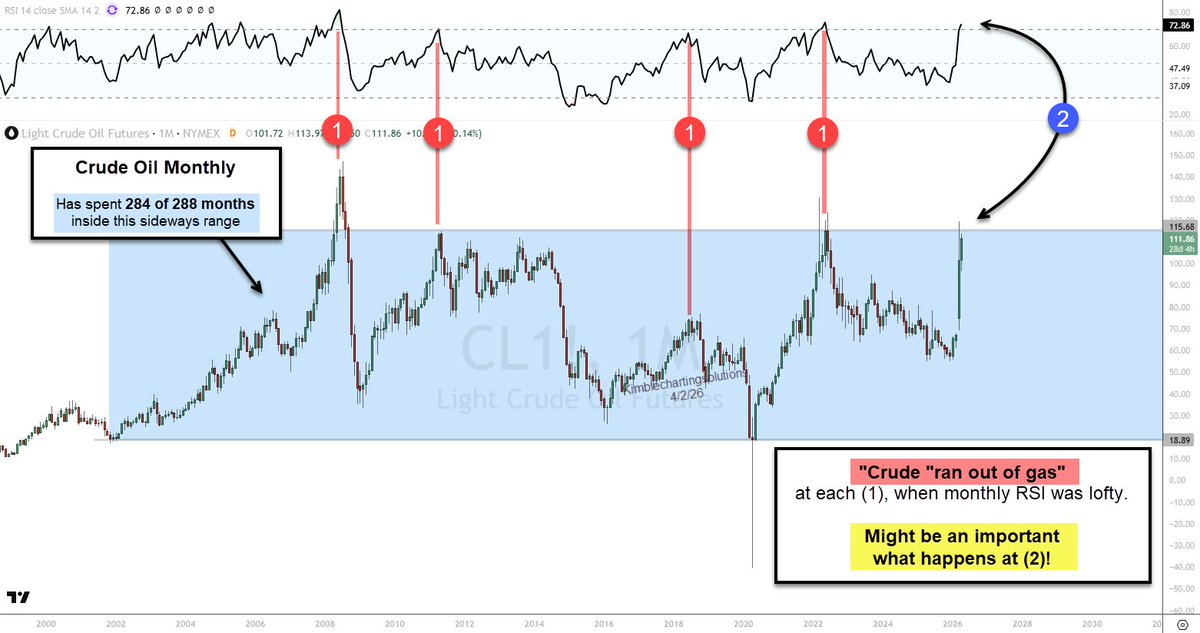
Crude Oil is testing the top of its 24-year trading range.
Examine the whole post from Chris Kimble.
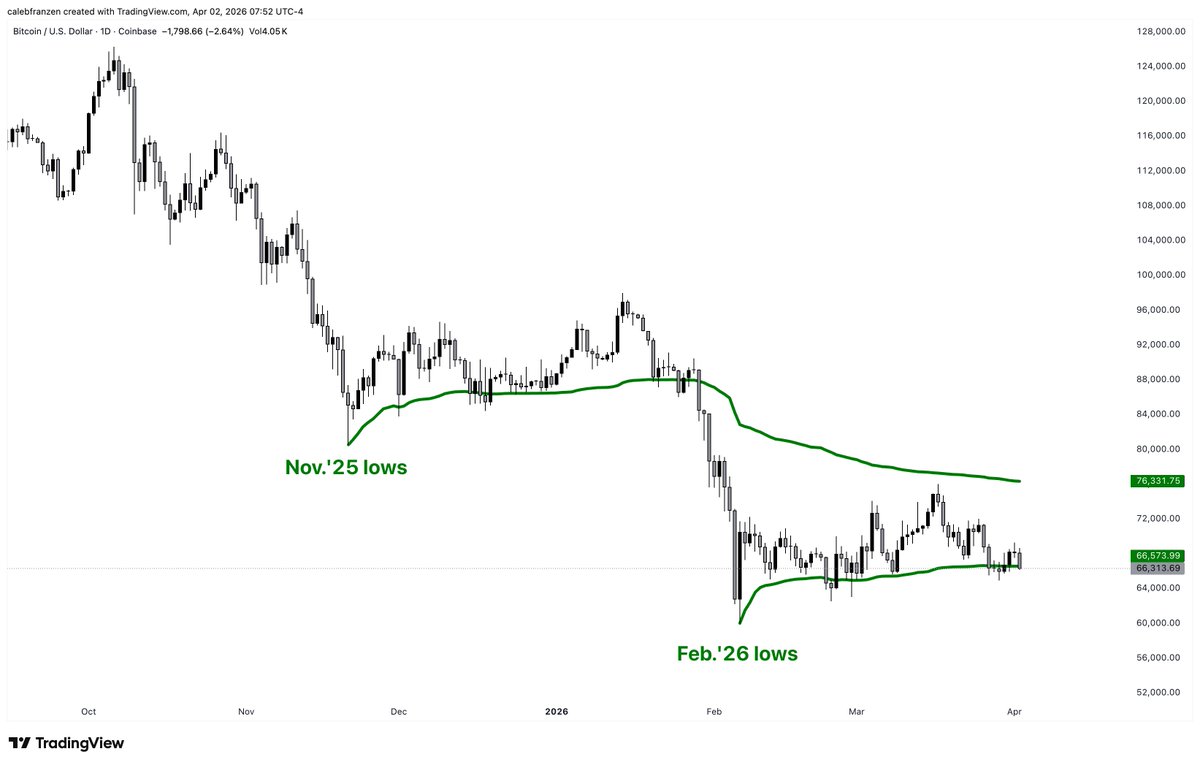
A loss of the February low AVWAP sets the stage for another breakdown in Bitcoin.
View the full tweet from Caleb Franzen.
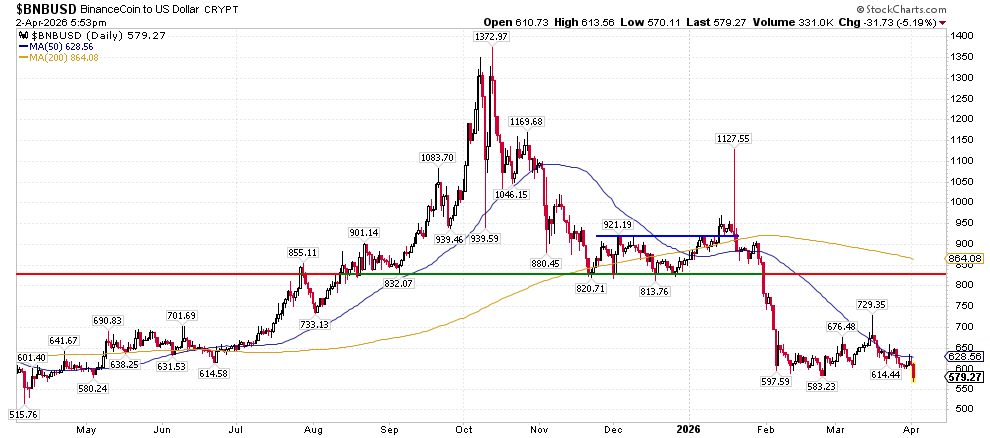
Binance is the first major crypto to fall below its pivot lows.
Check out the full post from Rotational Investing.
The Chart Report curates best-in-class technical analysis from across the web.
If you’d like to share a chart or just say hello, email us at [email protected]