A Record Gap Between the Index and Internals 📈 The Chart Report

Chart of the Day
🏆 Today's Chart of the Day was shared by Ryan Gorman.
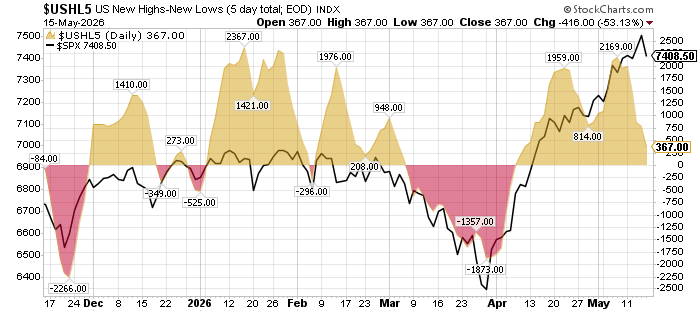
While the S&P 500 pushed to new highs last week, the US weekly new high/new low count had completely collapsed.
Underlying breadth and the S&P 500 have moved in opposite directions already 79 times this year, the most on record dating back to 1990.
The performance gap between the market’s largest stocks and the average stock continues to widen.
The Takeaway: Weakening breadth suggests the rally has become increasingly dependent on fewer names.
More Great Charts
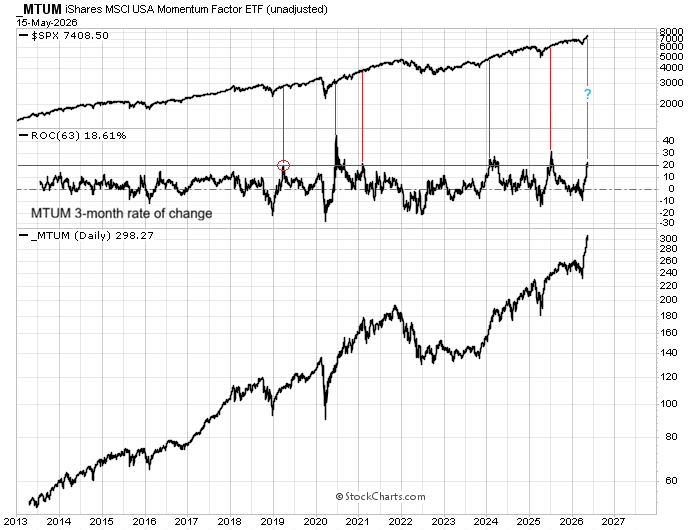
Strong momentum in the Momentum-Factor ETF (MTUM) has often preceded further gains in the S&P 500.
View the whole tweet from Mark Ungewitter.
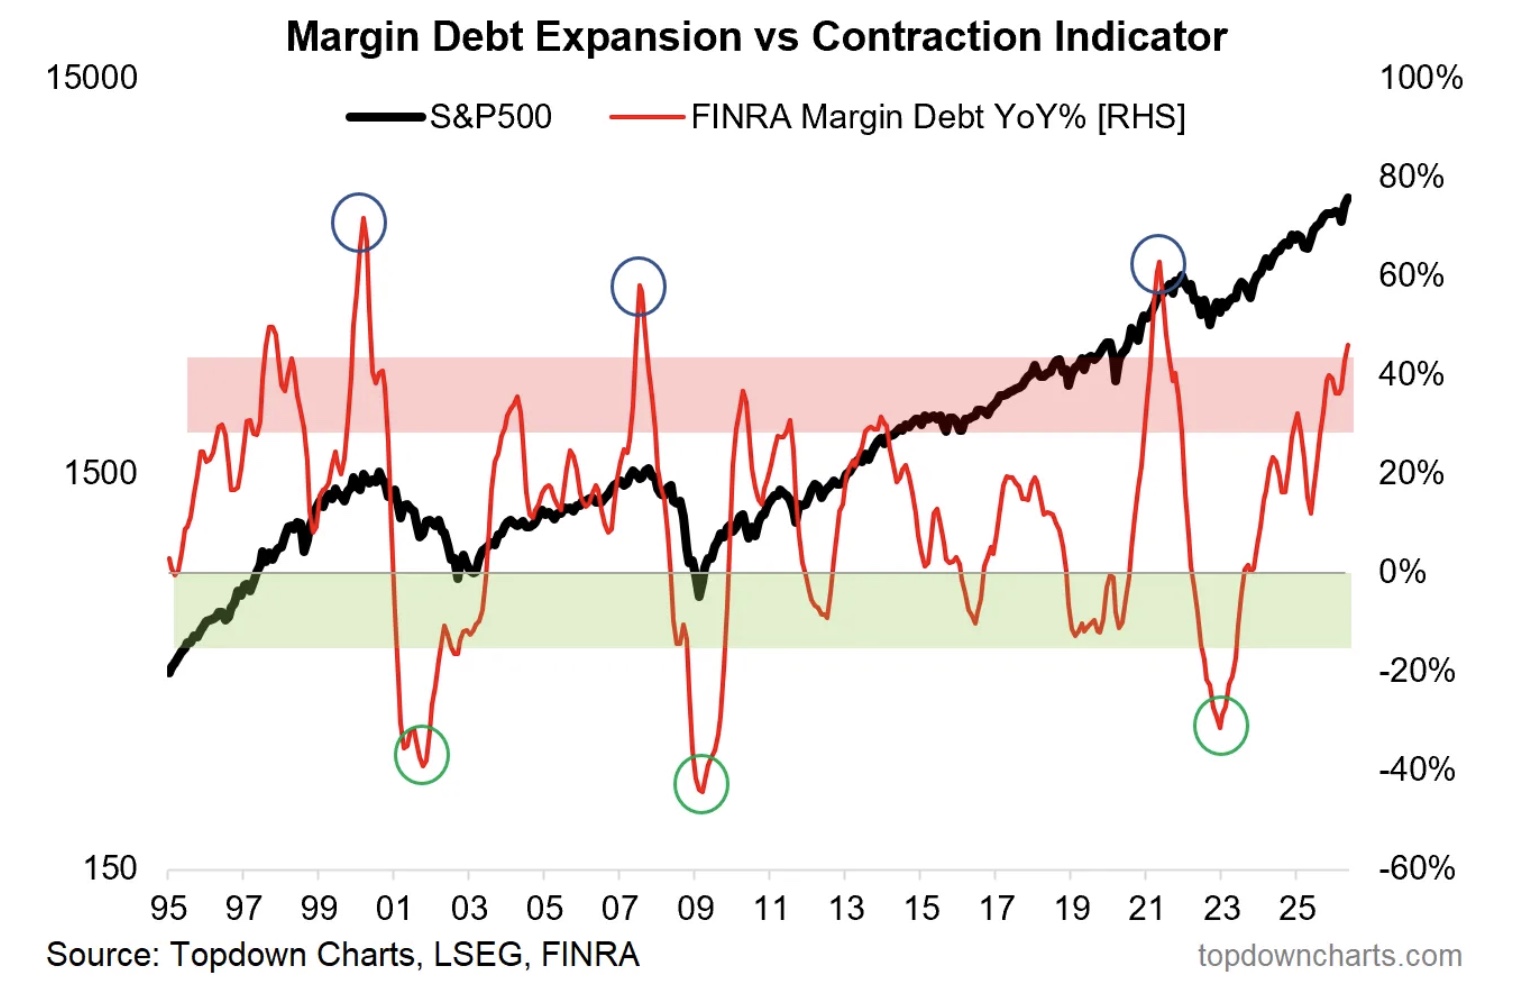
Margin Debt is approaching warning territory.
Read the full article from Callum Thomas.
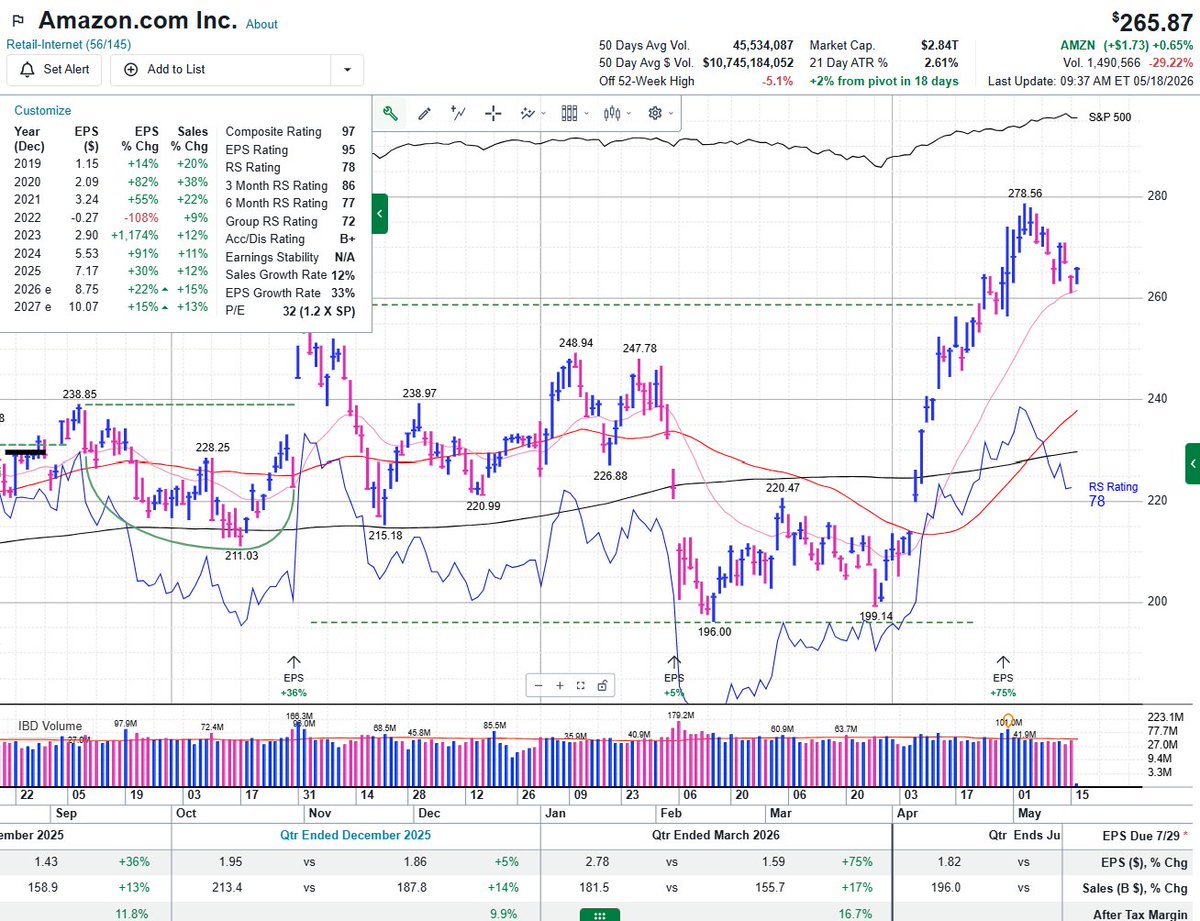
Amazon has pulled back into its prior highs at roughly $260.
See the entire post from TaPlot.
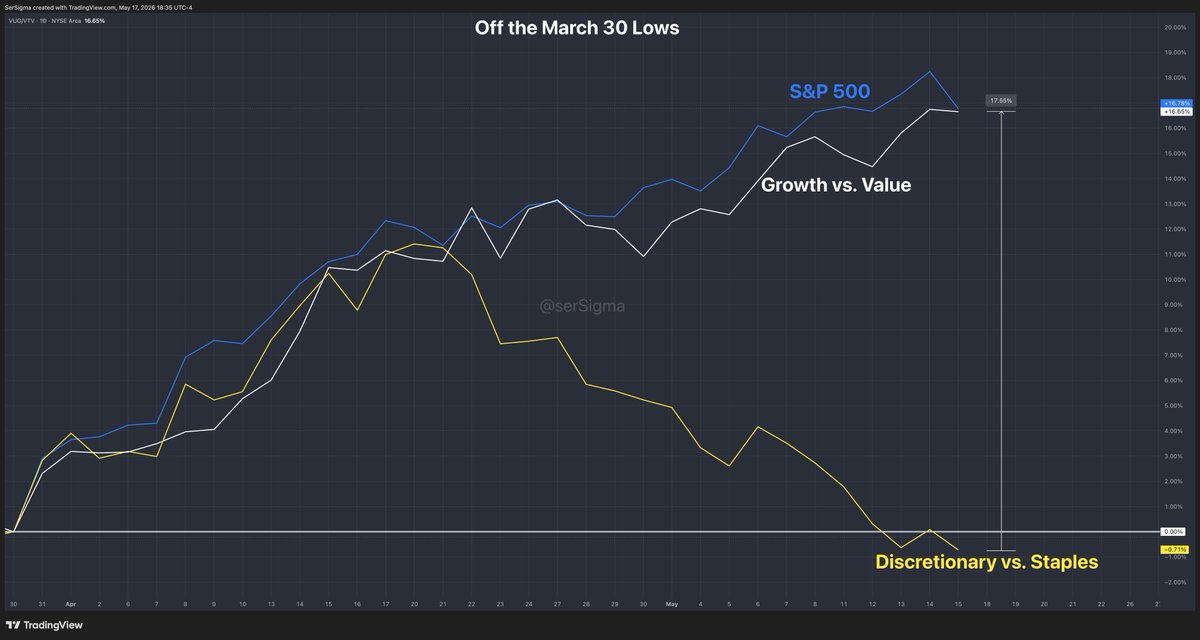
Consumer Discretionary relative to Consumer Staples has recently decoupled from both growth versus value and the S&P 500.
Examine the complete post from SerSigma.
The Utilities sector is making new all-time lows versus the S&P 500.
View the whole tweet from Trent Carroll.
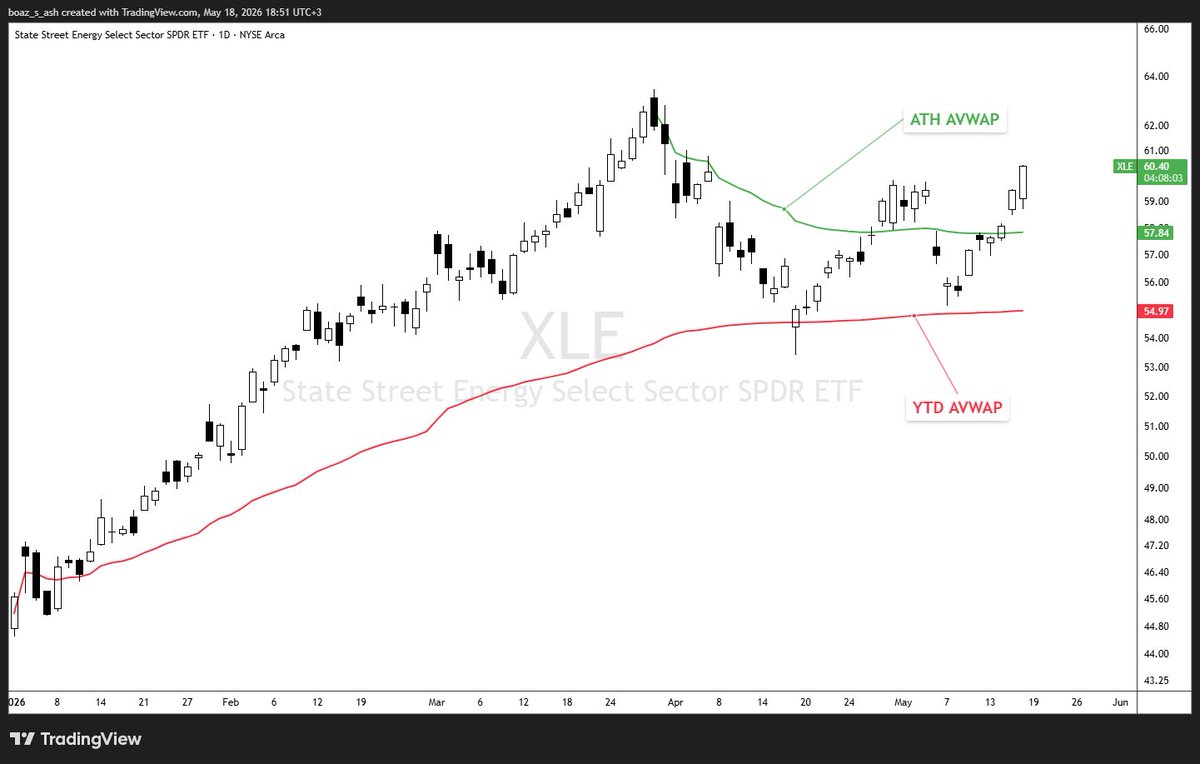
The Energy sector posted a bullish engulfing candle following a reclaim of its all-time high anchored VWAP.
See the entire tweet from Winged Flow.
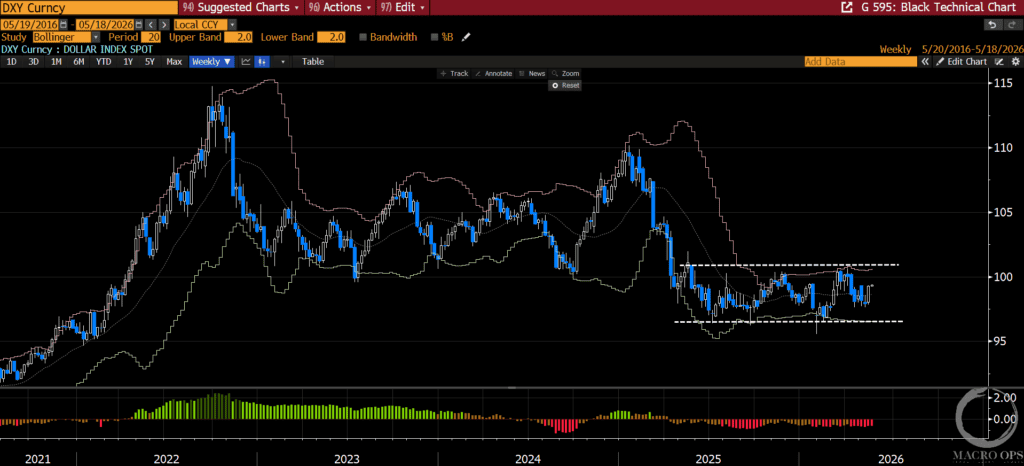
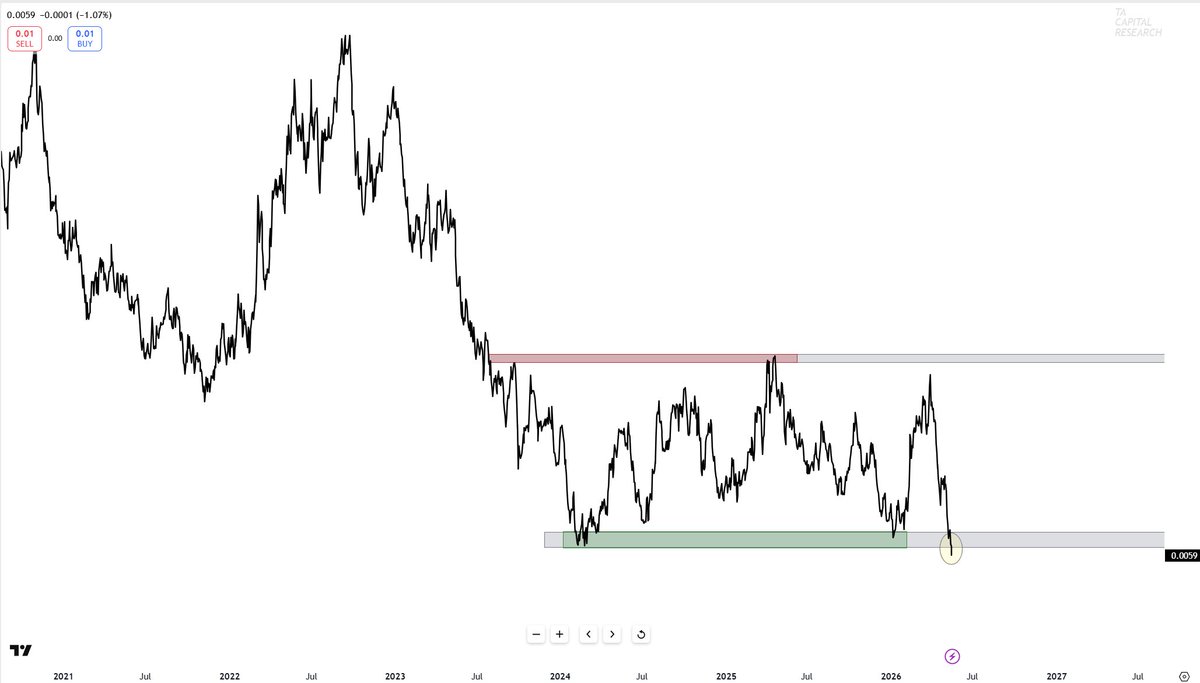
The U.S. Dollar Index continues to consolidate within a year-long range.
Check out the full thread from Alex Barrow.
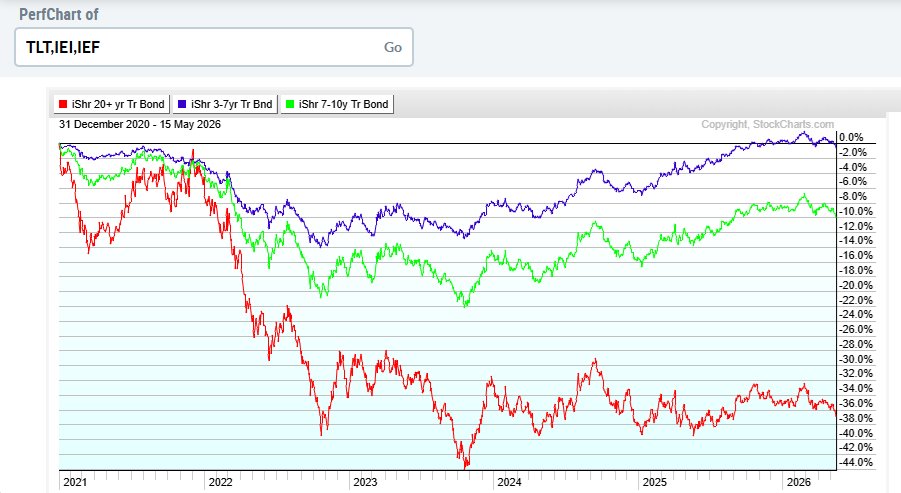
Since 2021, owning bonds has not only been opportunity cost, but also an outright drag on portfolio performance.
View the entire tweet from Chris Ciovacco.
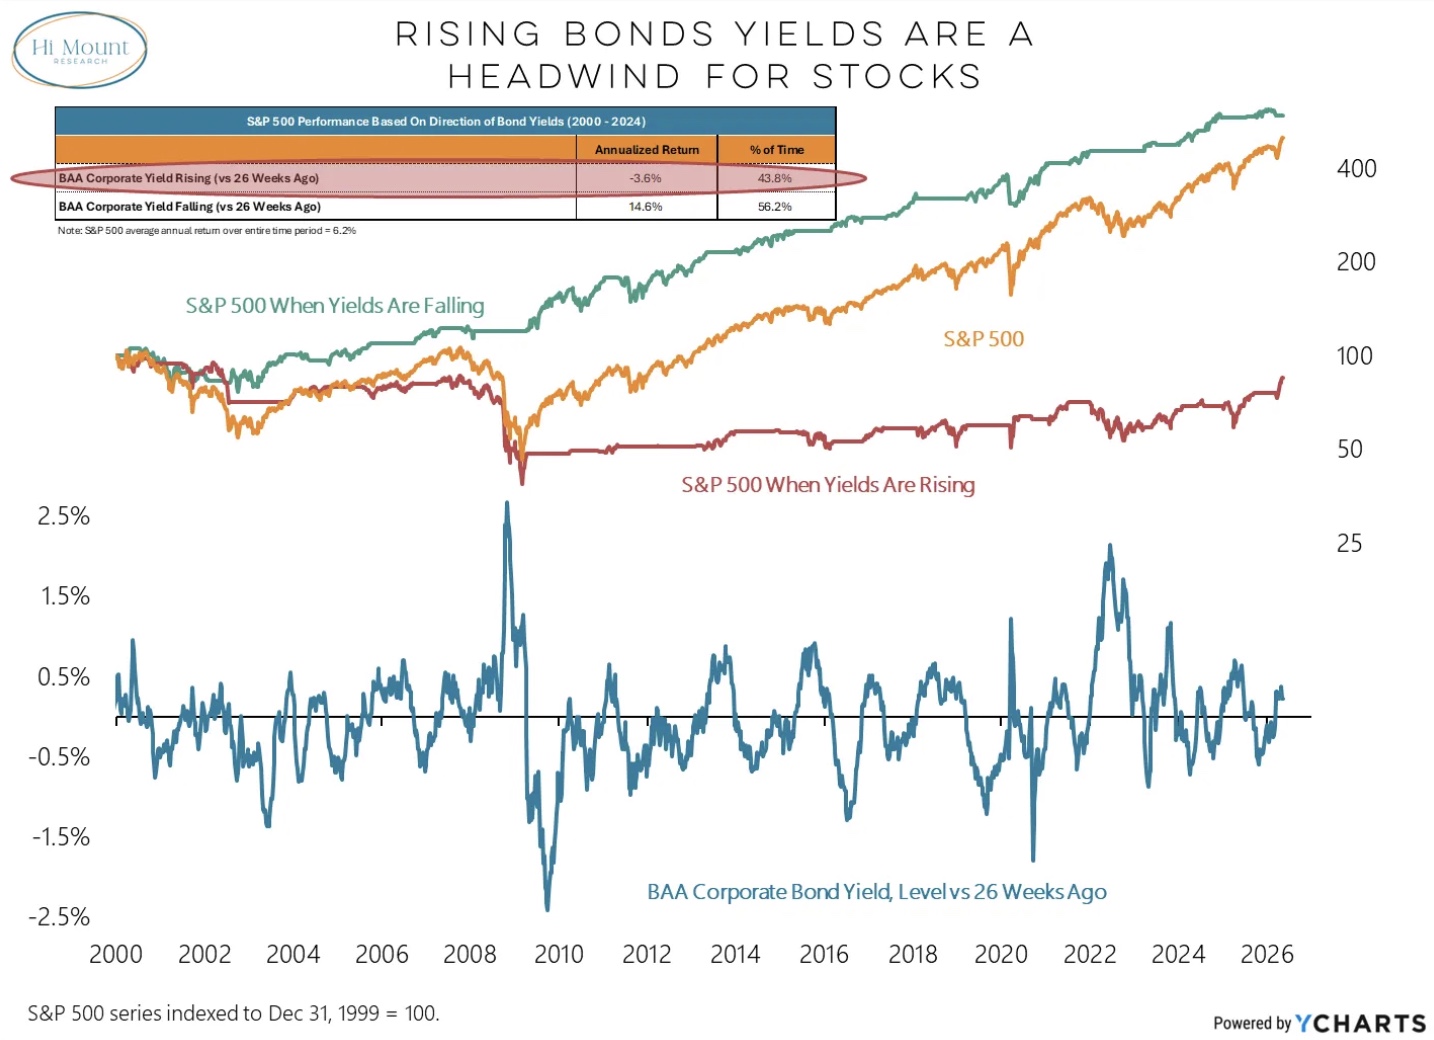
Going back to 2000, rising bond yields have been headwinds for stocks.
Read the complete analysis from Willie Delwiche.
The Chart Report curates best-in-class technical analysis from across the web.
If you’d like to share a chart or just say hello, email us at [email protected]