Is the Dollar Going to Follow Yields? 📈 The Chart Report

Chart of the Day
🏆 Today's Chart of the Day was shared by Matt Weller.
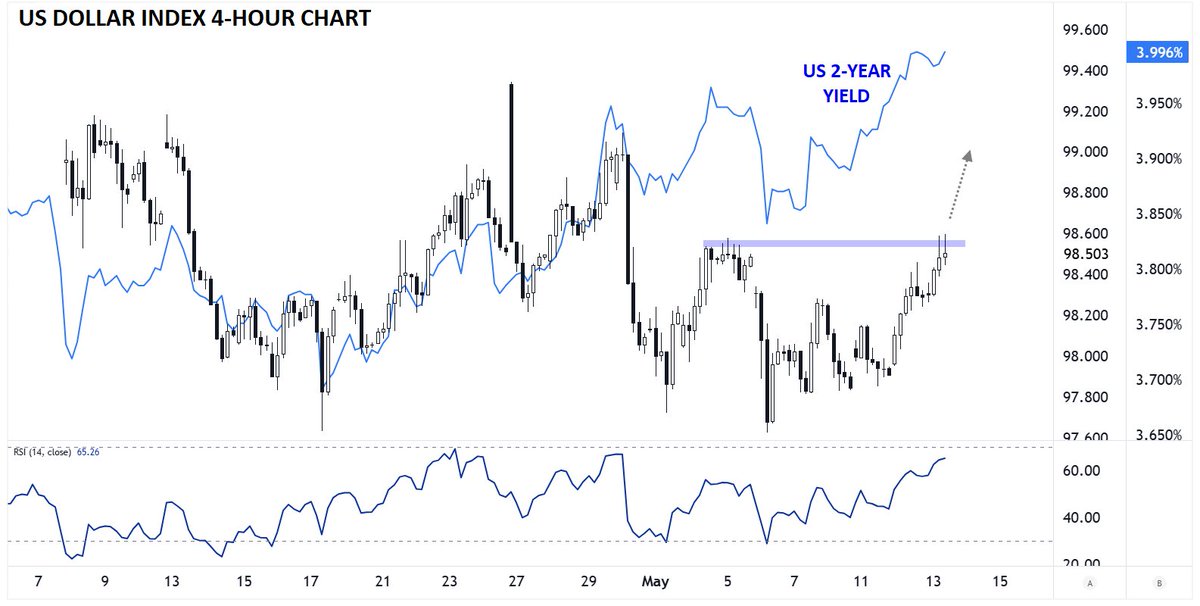
Markets have largely brushed aside two days of negative inflation headlines, even as both the 10-Year and 30-Year Treasury yields made new highs today.
Since the start of May, the U.S. Dollar Index has diverged from the 2-Year Yield and is now trying to break through its pivot highs around 98.500.
The Dollar has also recently flashed a bullish momentum divergence, and if follow-through develops, renewed Dollar strength could become a notable nuisance for both stocks and commodities.
The Takeaway: If the Dollar confirms its momentum shift, markets may face a tougher macro backdrop driven by higher yields and tighter financial conditions.
More Great Charts
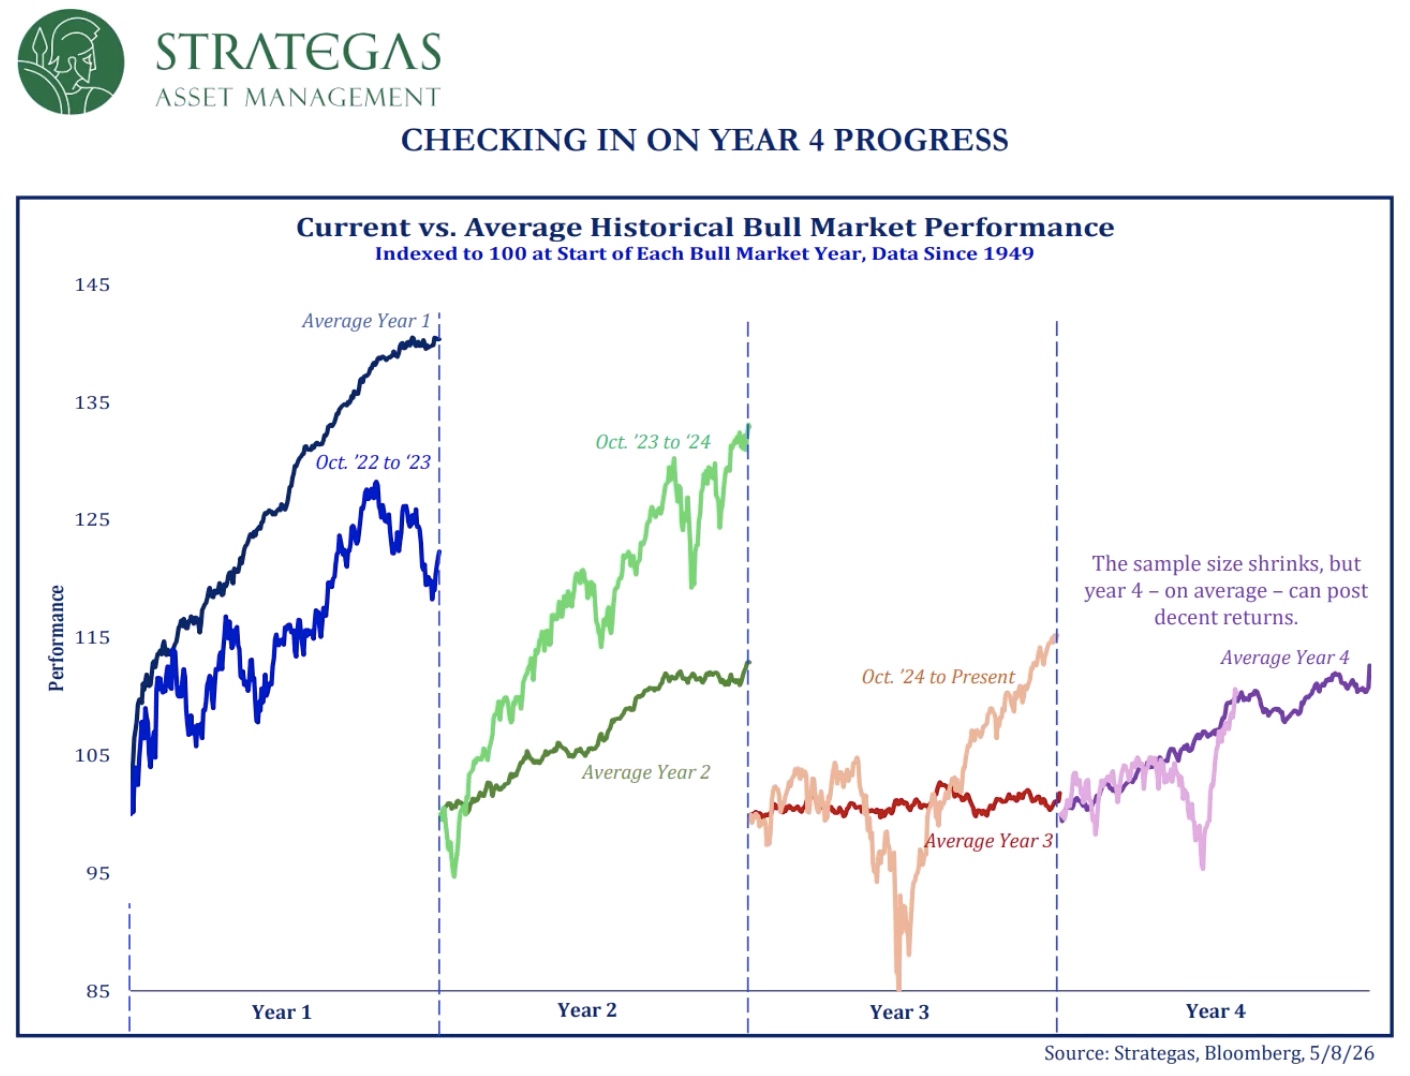
Year four of bull markets have typically produced more modest returns.
Watch the complete analysis from Todd Sohn.
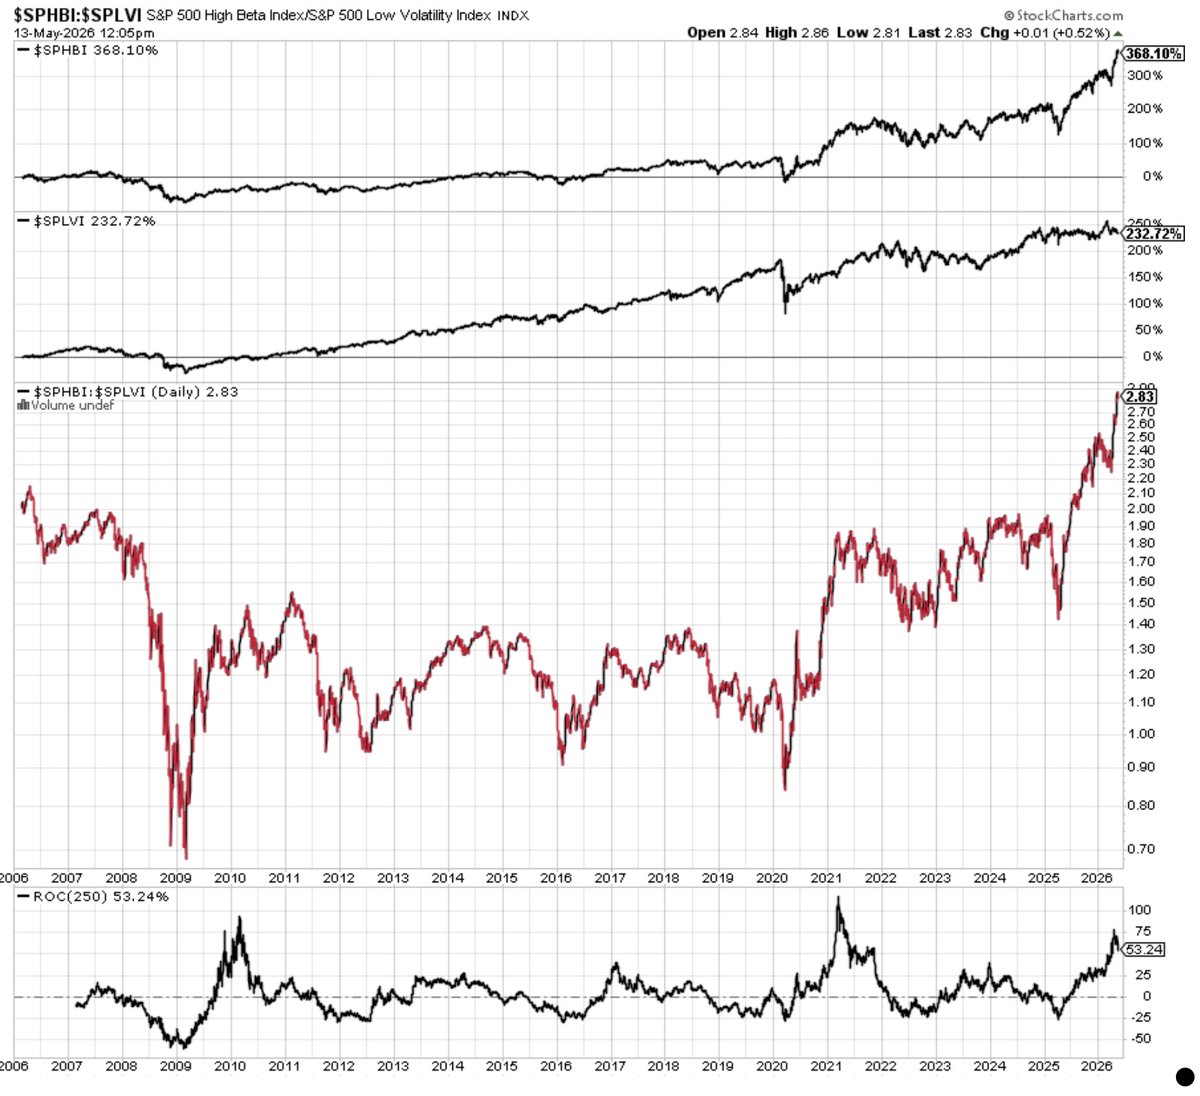
High Beta relative to Low Volatility is at all-time highs.
View the whole tweet from Tobias Carlisle.
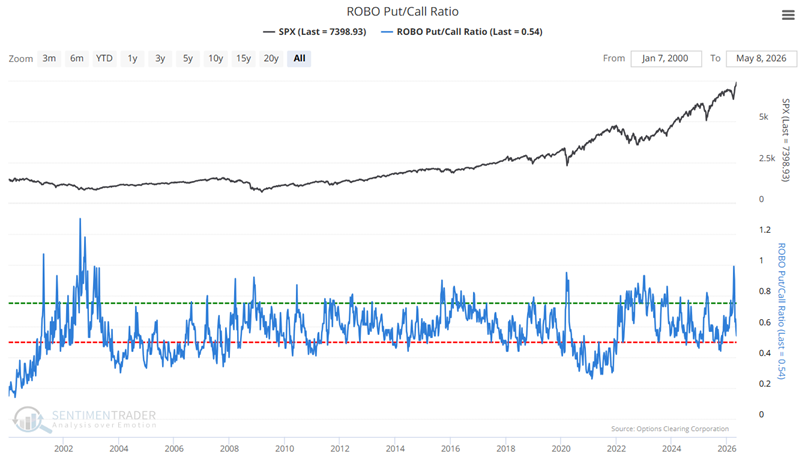
Retail traders are piling into puts at a historic pace even as $SPY trades at fresh all-time highs.
This setup has occurred just 10 times since 2002, and one year later the market was higher every time with a median gain of +20.76%.
See the full post from Sentiment Trader.
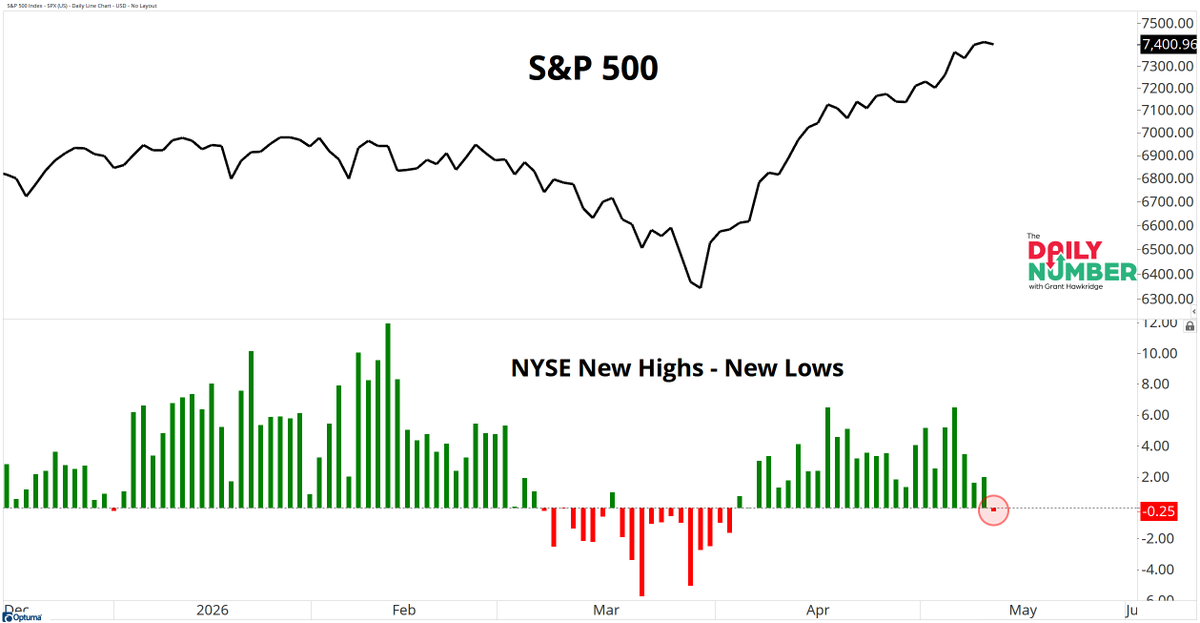
For the first time in 27 trading sessions, NYSE new lows outpaced new highs.
Read the entire analysis from Grant Hawkridge.
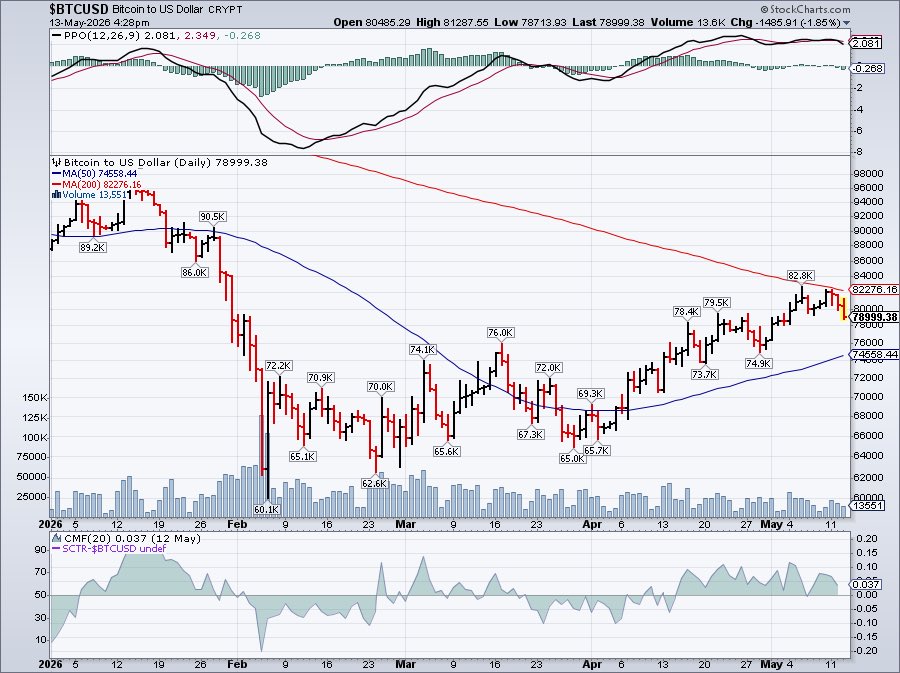
The 200-day moving average has acted as resistance for Bitcoin.
Check out the complete post from Crypto Birb.
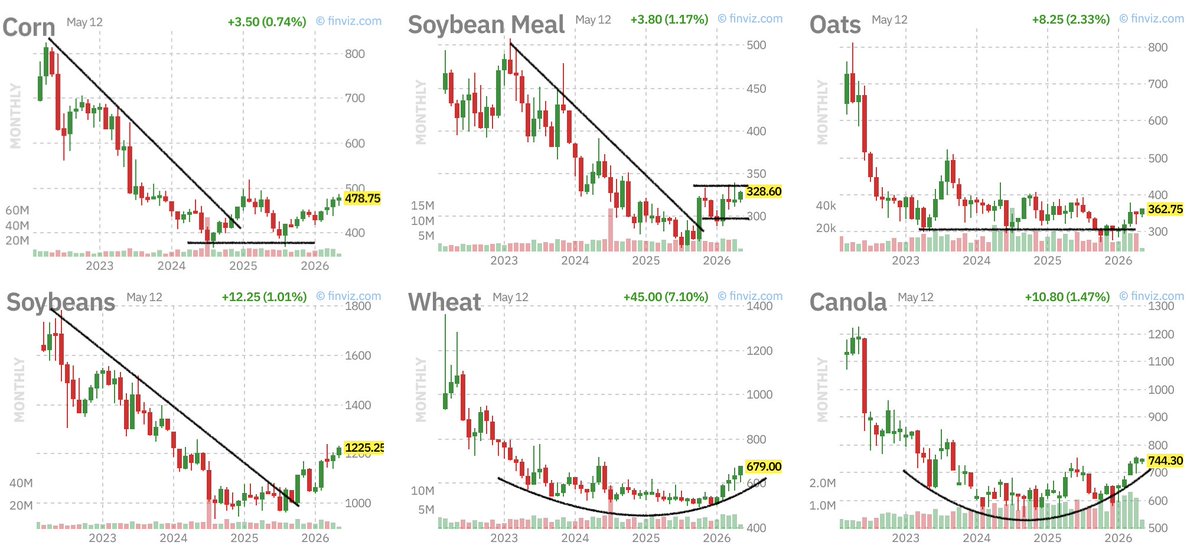
Agricultural commodities are moving higher as several attempt to emerge from their long-term bases.
Examine the full tweet from Arun Chopra.
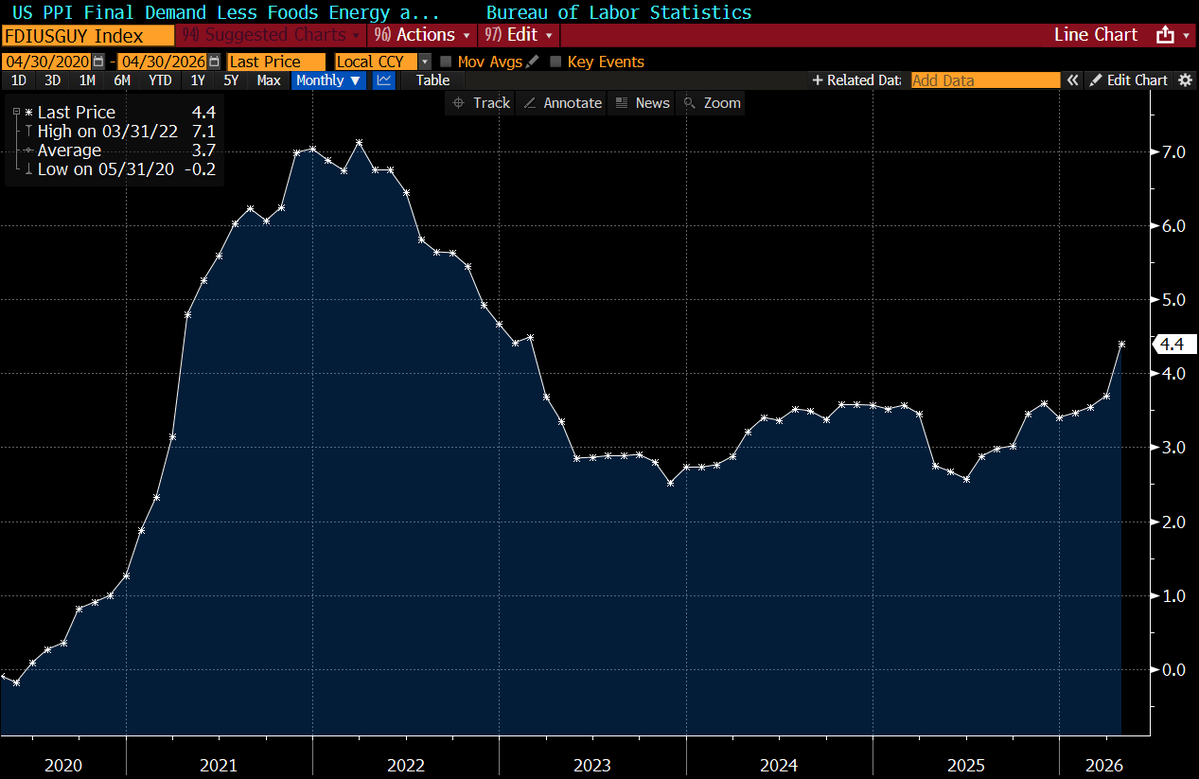
U.S. Producer Prices accelerated sharply in April, posting the biggest year-over-year increase in five years.
See the whole post from Lisa Abramowicz.
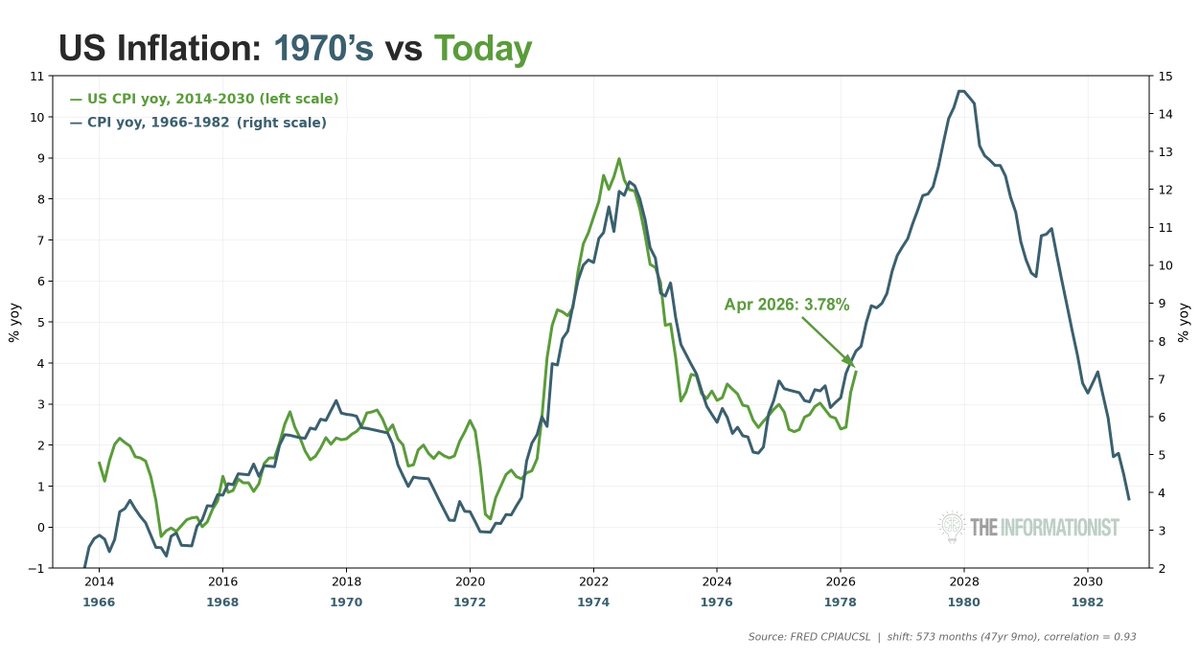
There are growing similarities between the current inflation regime and the inflation cycle of the 1970s.
View the entire tweet from James Lavish.
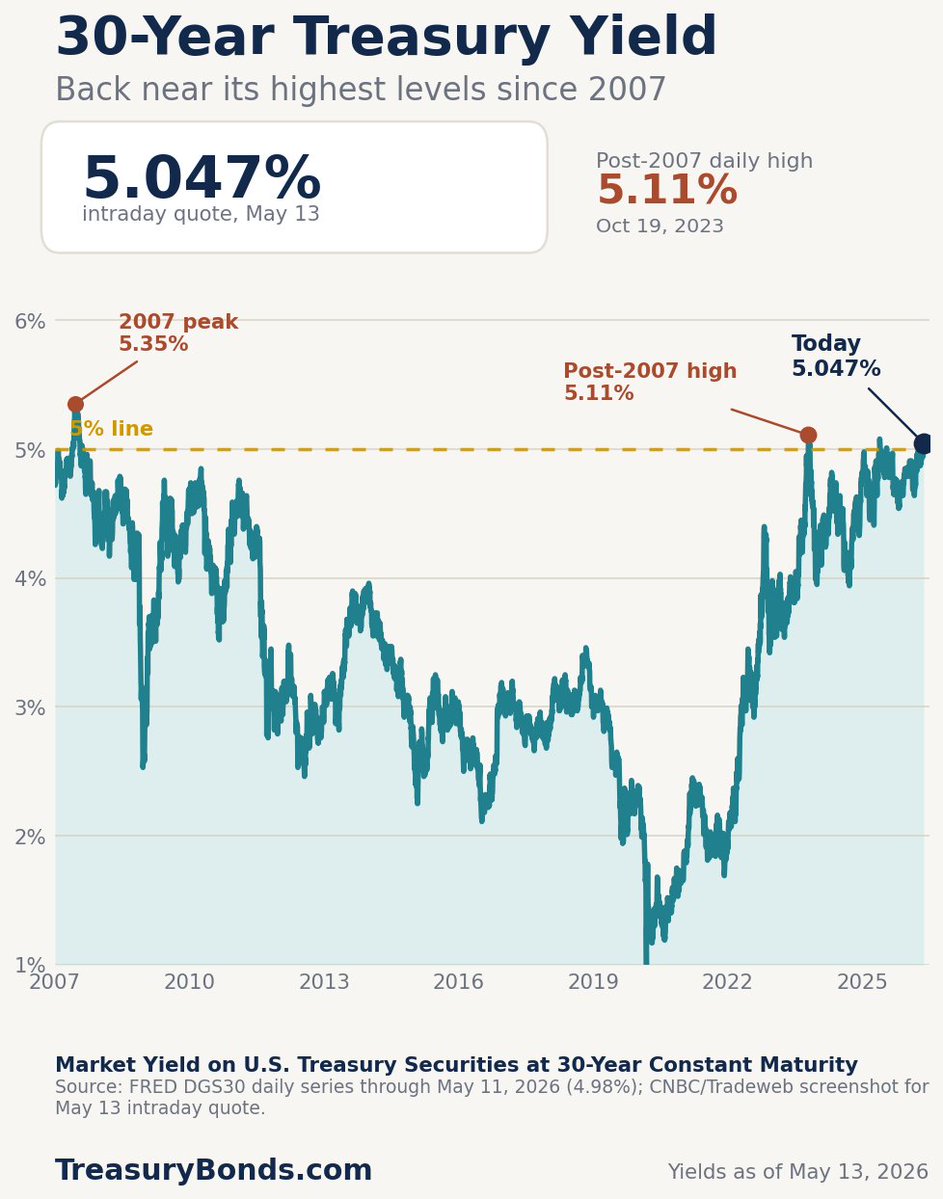
The 30-year Treasury yield has climbed back above 5%, nearing its highest levels since 2007.
Check out the complete post from TreasuryBonds.com.
The Chart Report curates best-in-class technical analysis from across the web.
If you’d like to share a chart or just say hello, email us at [email protected]