Inflation Fears Are Creeping Back 📈 The Chart Report

Chart of the Day
🏆 Today's Chart of the Day was shared by J.C. Parets.
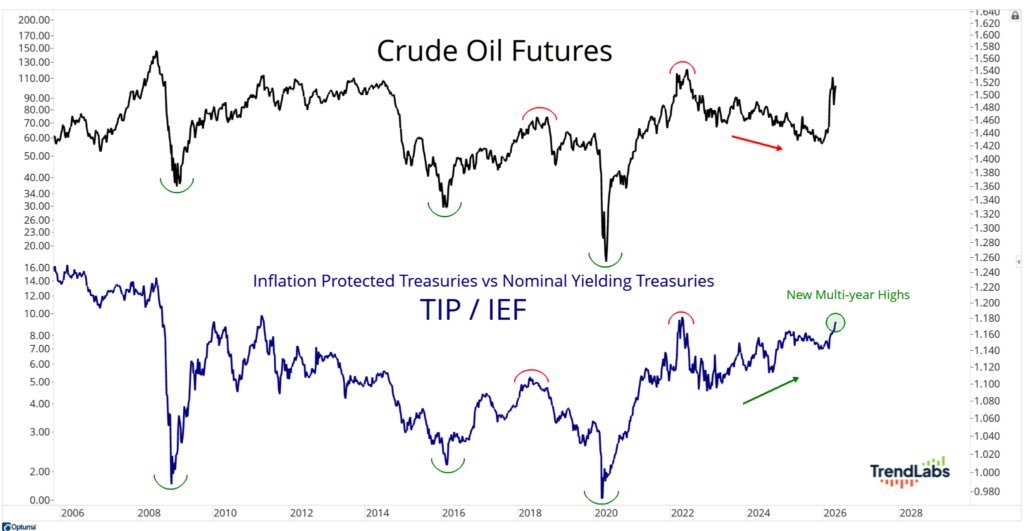
Inflation-protected U.S. Treasuries are making new multi-year highs relative to nominal treasuries, signaling that the bond market is starting to price in higher inflation.
At the same time, the Bloomberg Commodity Index is pressing into new all-time highs, and pointing to a potential rebound in inflation as its historically tight relationship has diverged in recent years.
If inflation begins to re-accelerate similar to 2021, we could see a meaningful rotation of capital into more areas that are less sensitive to interest rates.
The Takeaway: Following today’s hotter than expected inflation data, we can look to both the bond market and commodities for clues on where inflation may be headed next.
More Great Charts
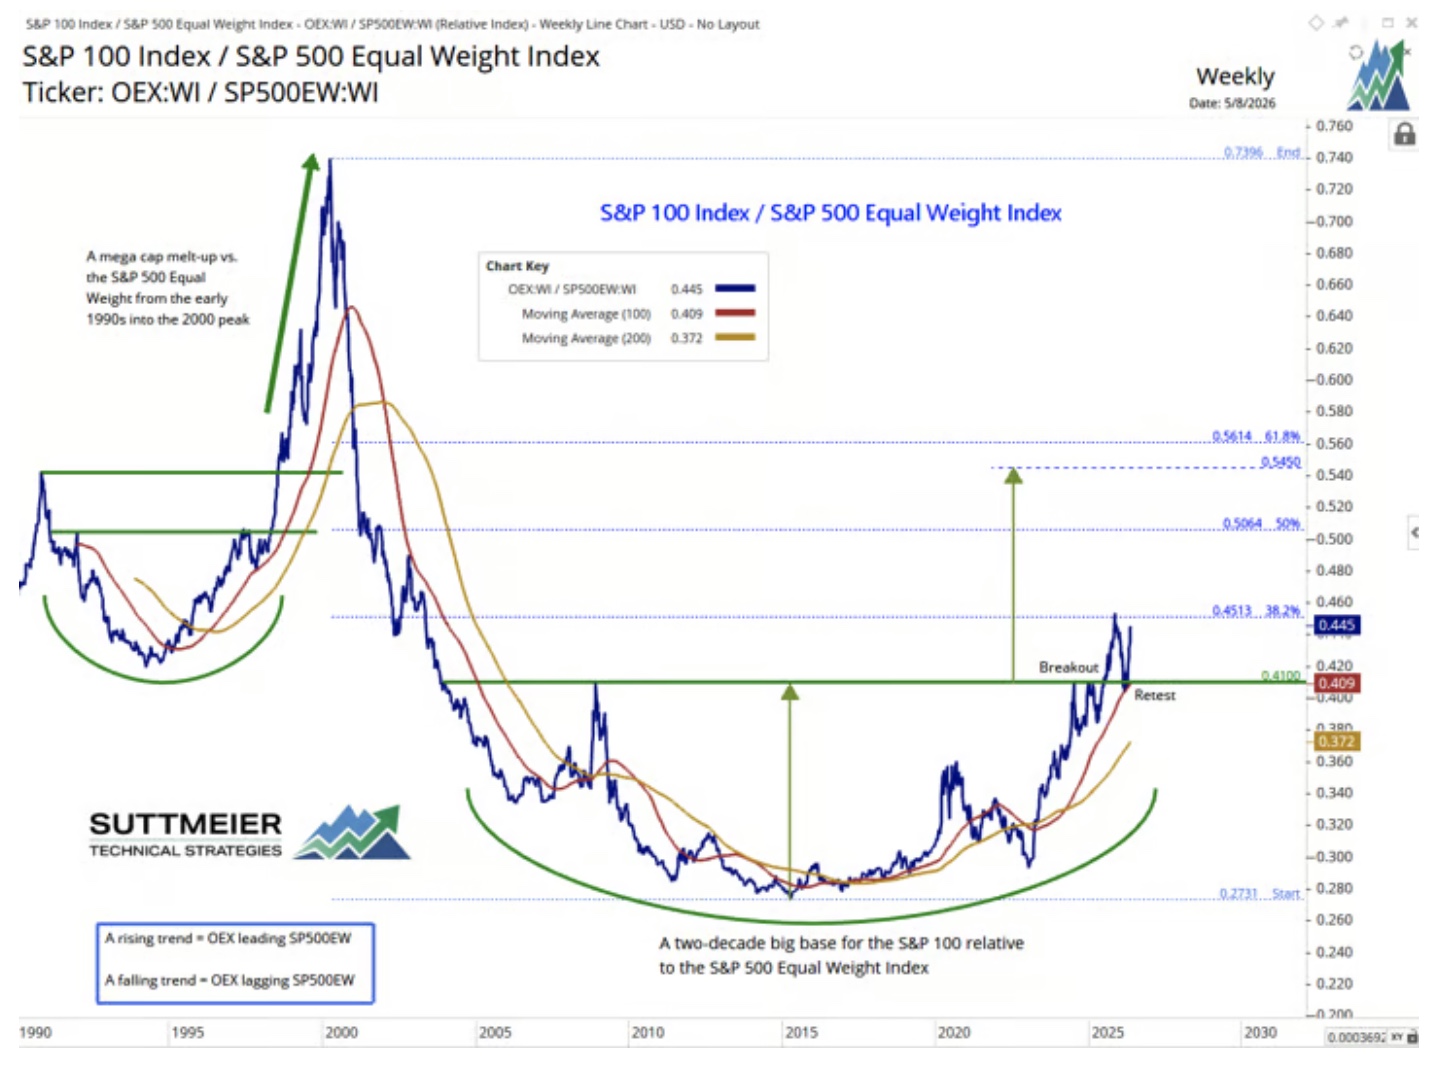
The S&P 100 shows a bullish breakout and retest versus the average S&P 500 stock.
Read the complete analysis from Stephen Suttmeier.
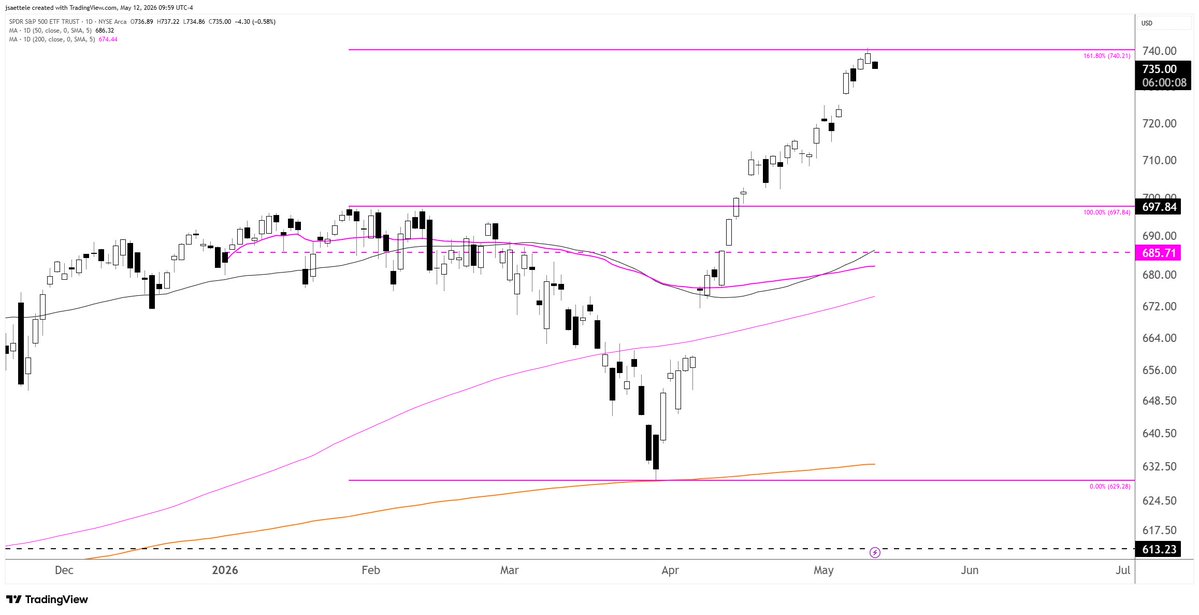
The S&P 500 has found resistance at the 1.618% Fibonacci extension level.
View the whole tweet from Jamie Saettele.
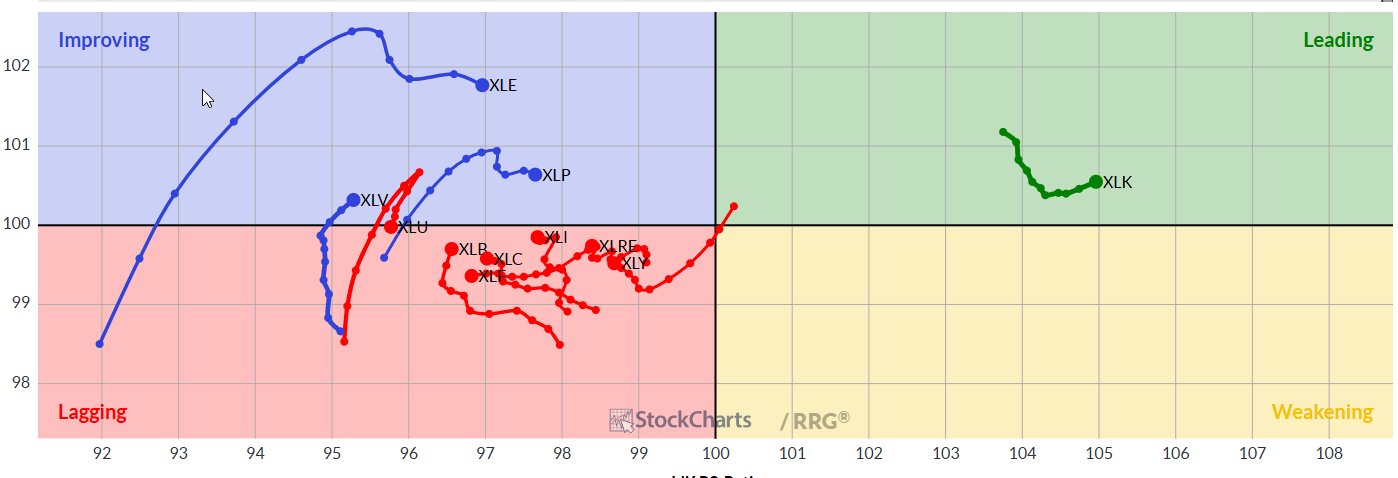
The Relative Rotation Graph shows improving momentum in Energy, Consumer Staples, and Healthcare, while Technology remains the clear market leader.
See the full post from David Settle.
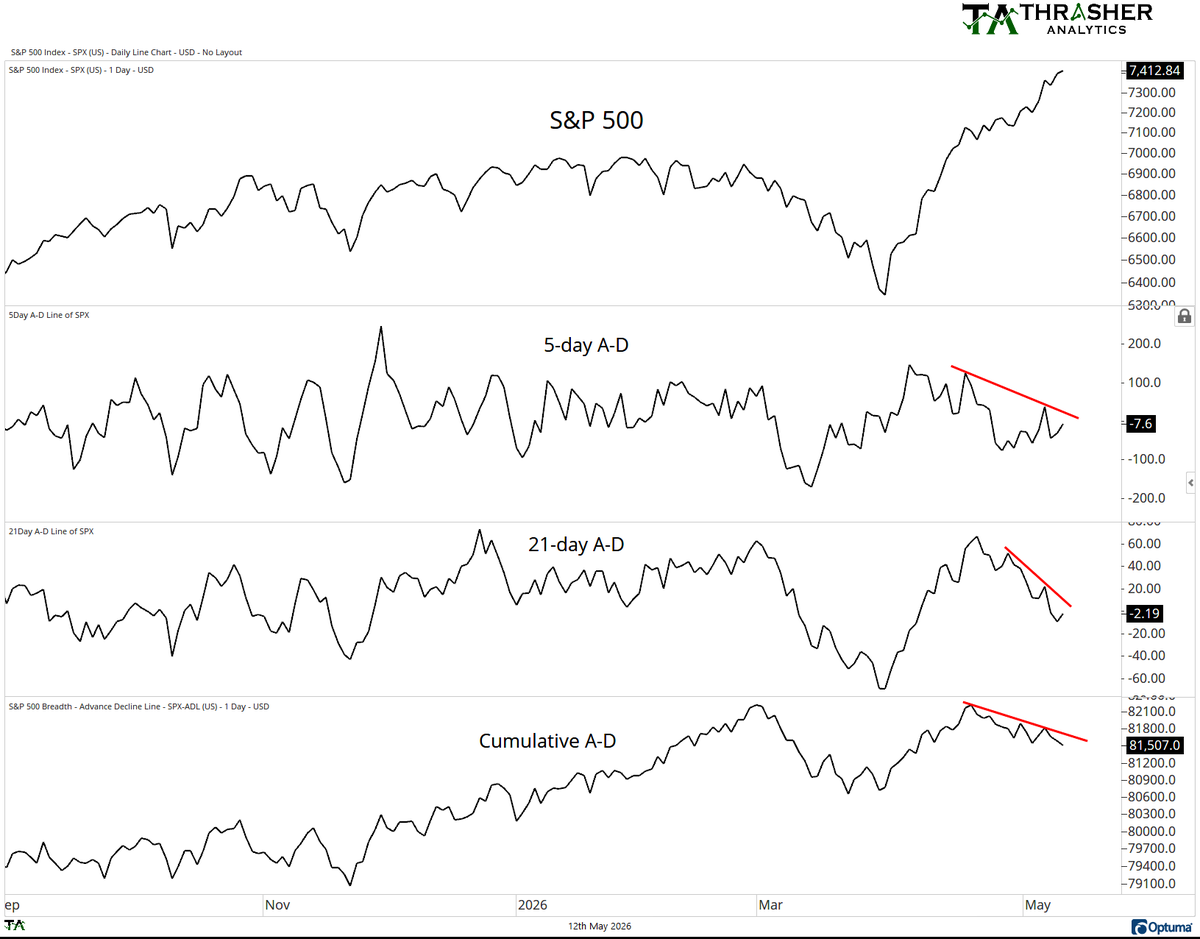
Since April 20th, the S&P 500 has continued trending higher even as the 5-day, 21-day, and cumulative Advance-Decline Lines have diverged lower.
Examine the entire tweet from Andrew Thrasher.
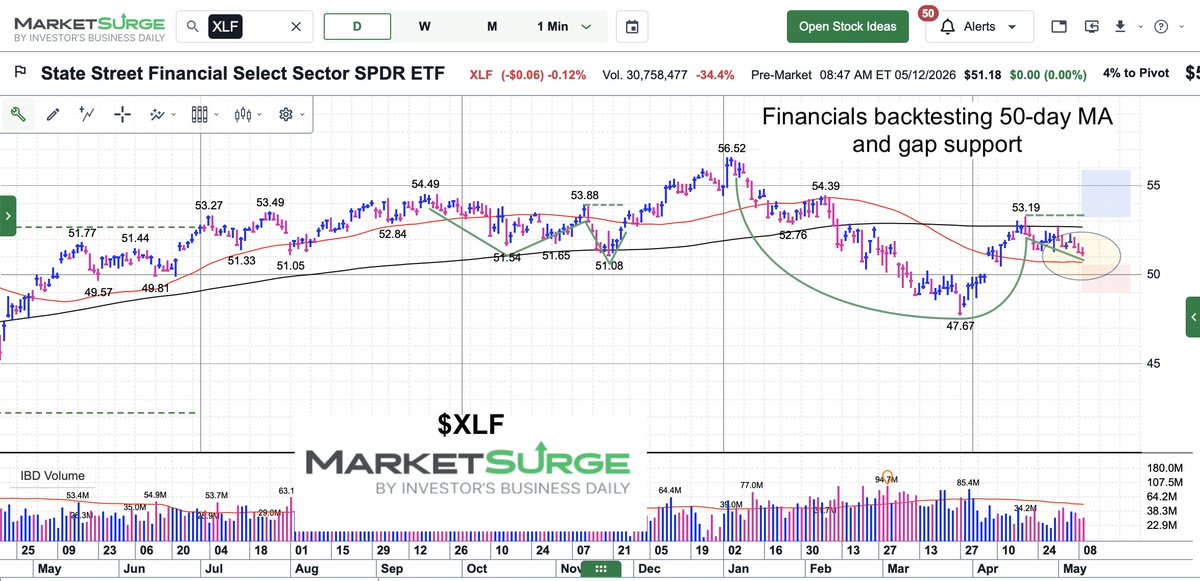
Financials are currently testing their 50-day moving average.
Check out the complete post from See It Market.
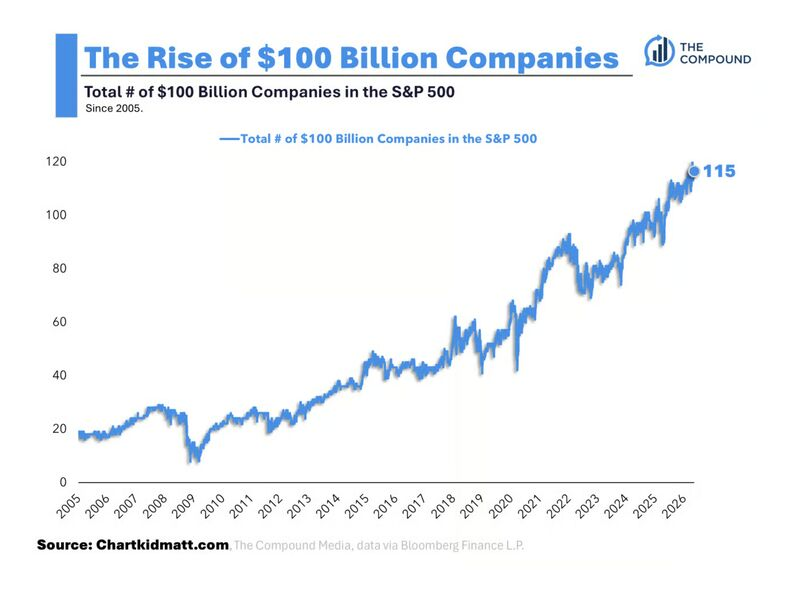
The number of $100 billion companies in the S&P 500 has surged to 115, up from just 42 at the Covid lows.
Read the full article from Matt Cerminaro.
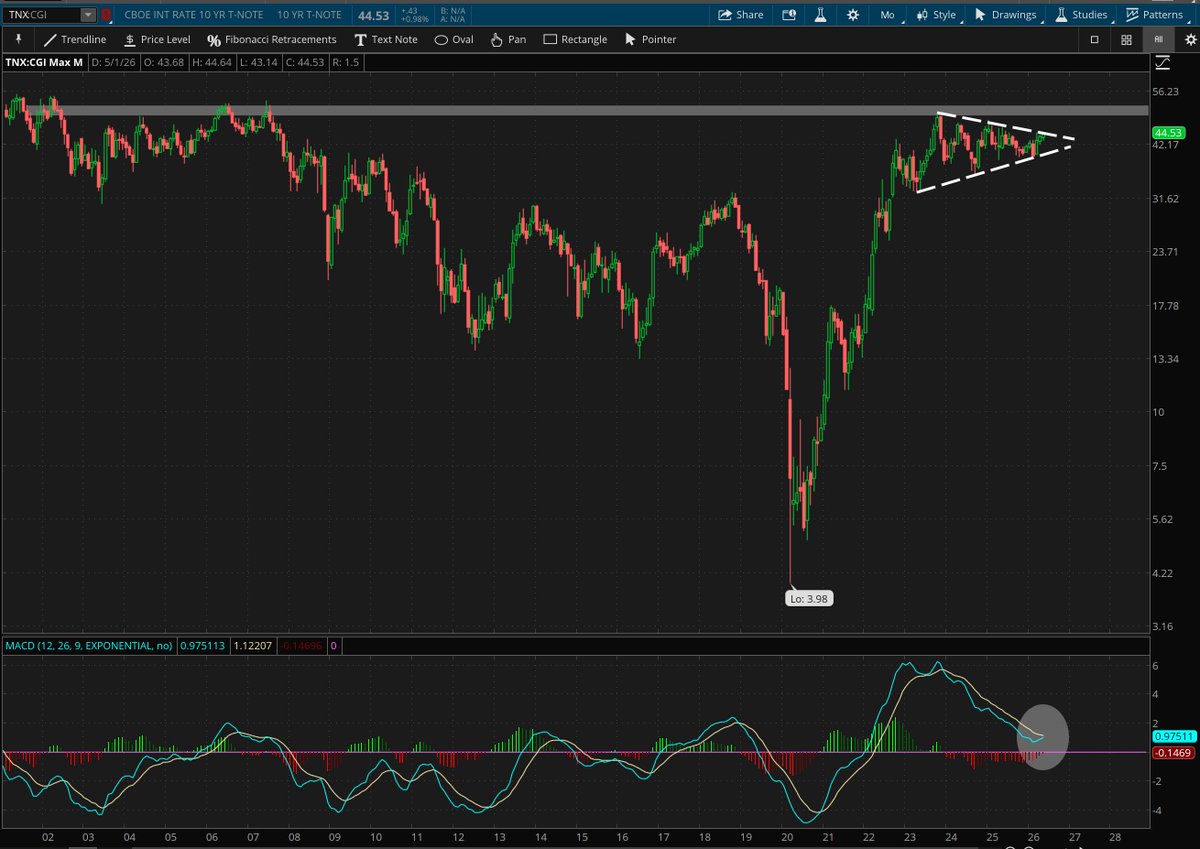
The 10-year Treasury yield is approaching trendline resistance from its three-year consolidation pattern, while the monthly MACD appears close to a bullish crossover.
View the whole post from Rachel Dashiell.
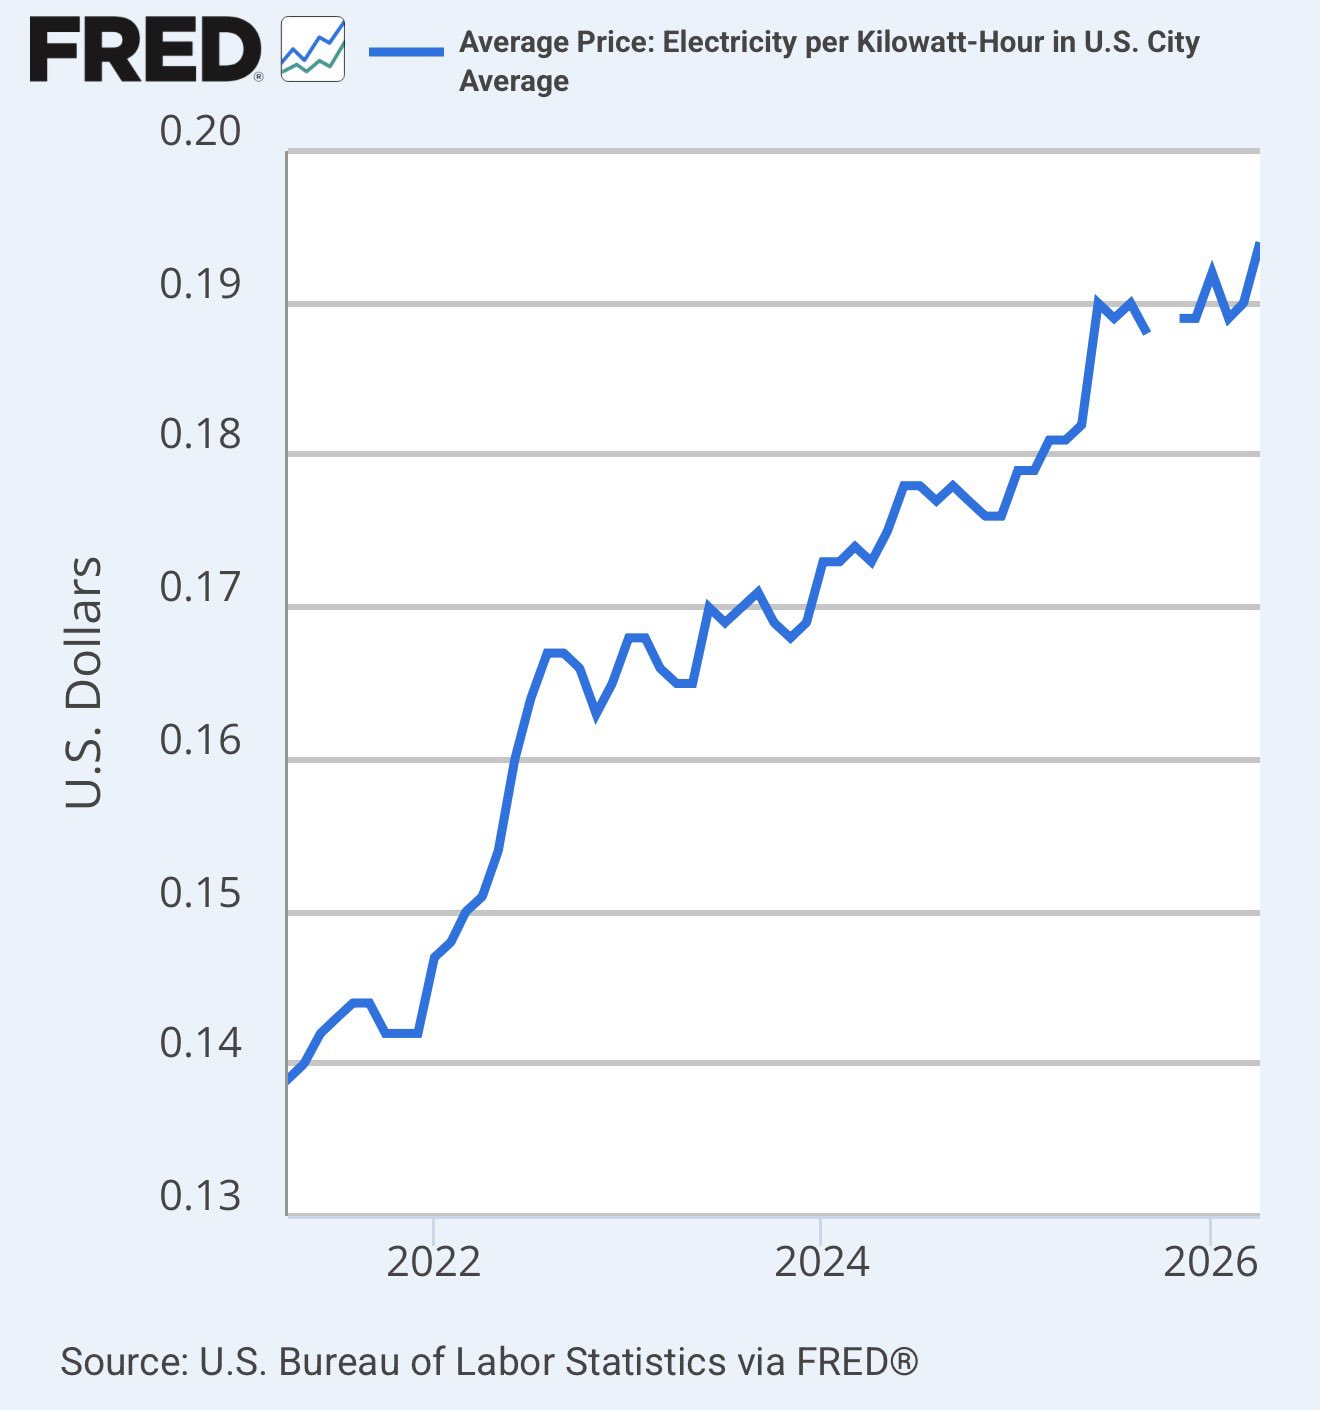
U.S. Electricity prices are making new all-time highs.
See the entire tweet from Don Johnson.
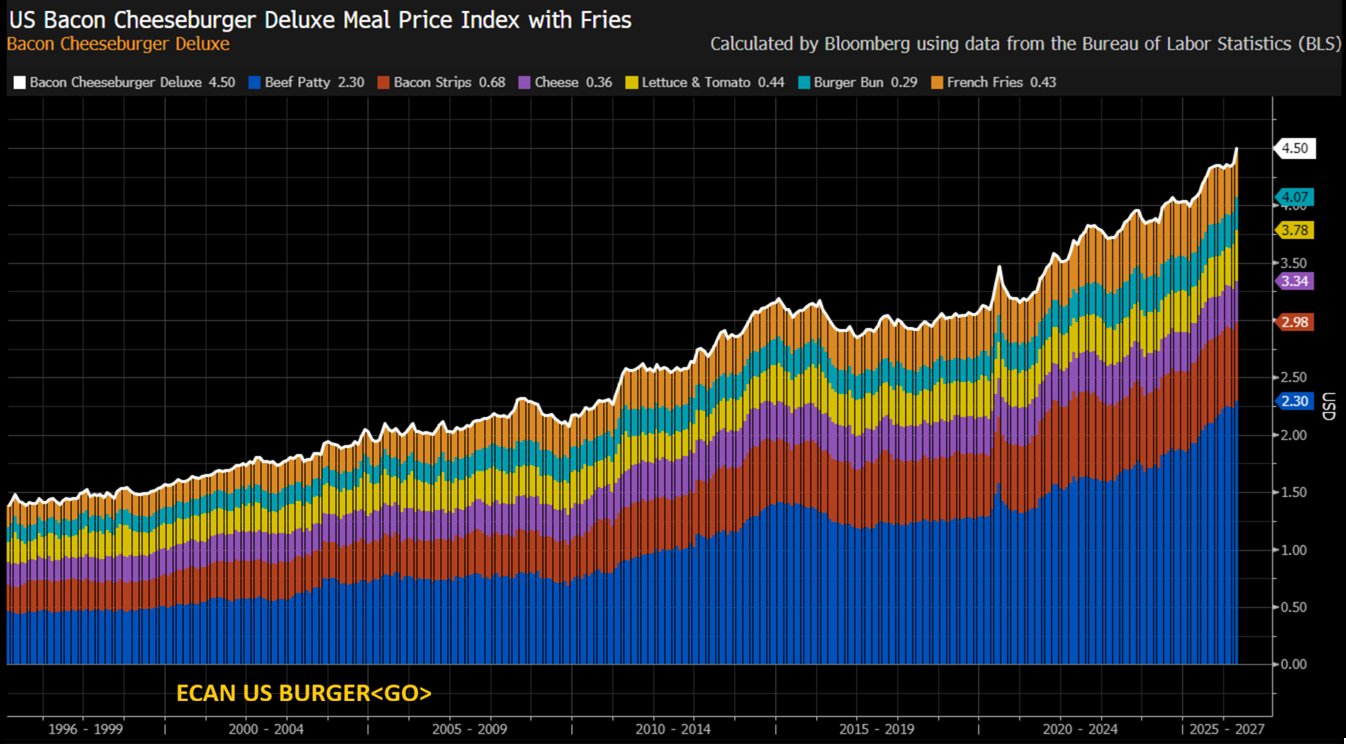
The Bacon Cheeseburger Deluxe Index (a measure tracking cheeseburger costs) has risen to new record highs.
Check out the complete post from Michael McDonough.
The Chart Report curates best-in-class technical analysis from across the web.
If you’d like to share a chart or just say hello, email us at [email protected]