Small Caps Are Testing a Critical Level 📈 The Chart Report

Chart of the Day
🏆 Today's Chart of the Day was shared by Evan Medeiros.
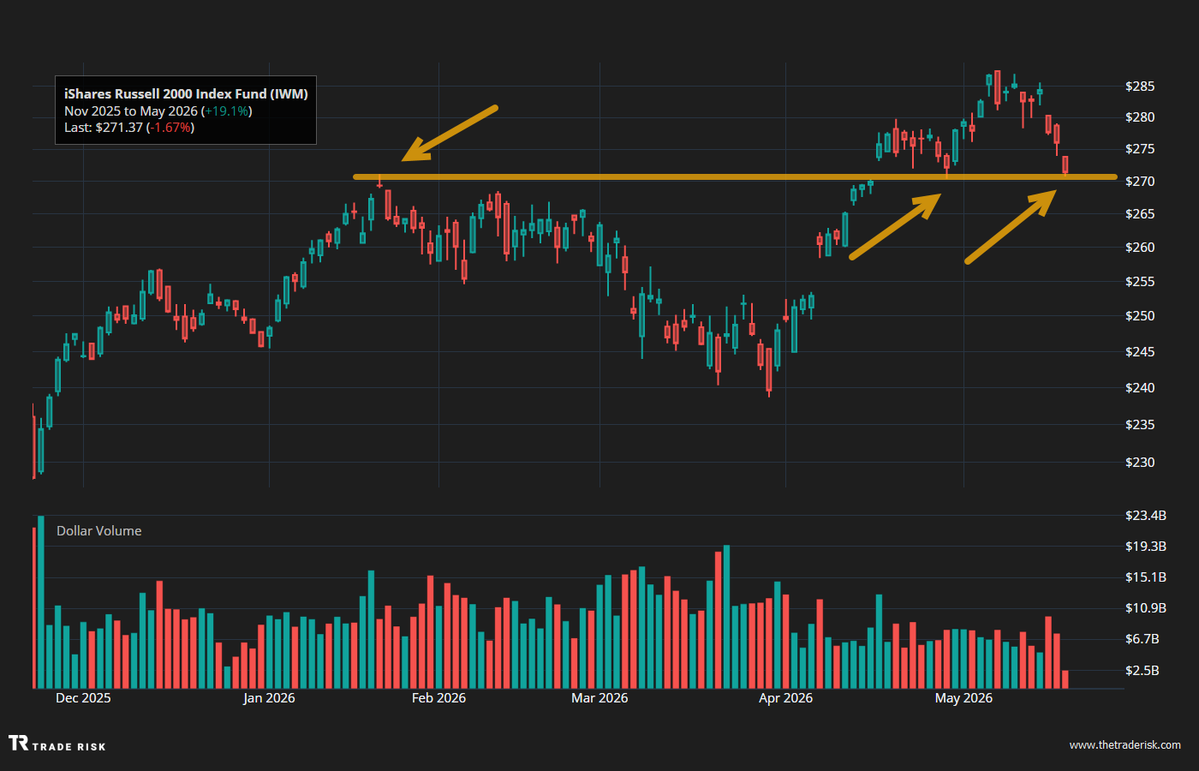
The Russell 2000 has pulled back into the polarity zone of roughly $270 after three consecutive down days.
This level aligns with the prior highs from January and already proved its importance after acting as support on a recent retest just weeks ago.
What happens here may offer important insight into the broader market if small caps fail to hold a level of former support.
The Takeaway: The Russell 2000 is back at a level that could matter for the entire market.
More Great Charts
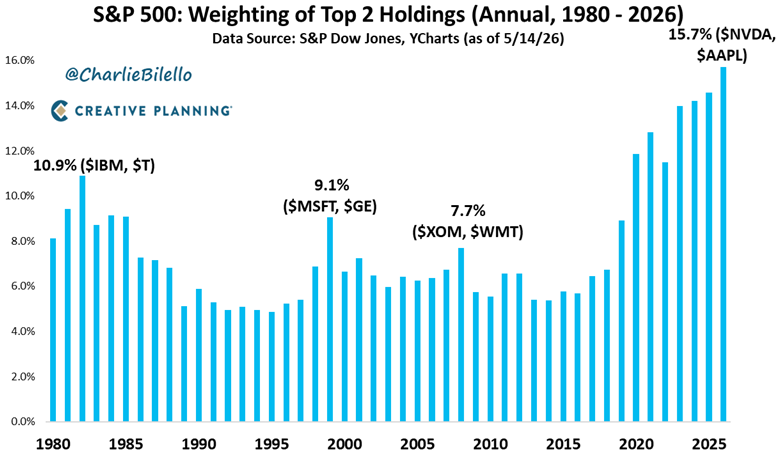
The S&P 500 has never been this concentrated in just two companies, with Nvidia and Apple now accounting for more than 15% of the entire index.
View the whole tweet from Peter Mallouk.
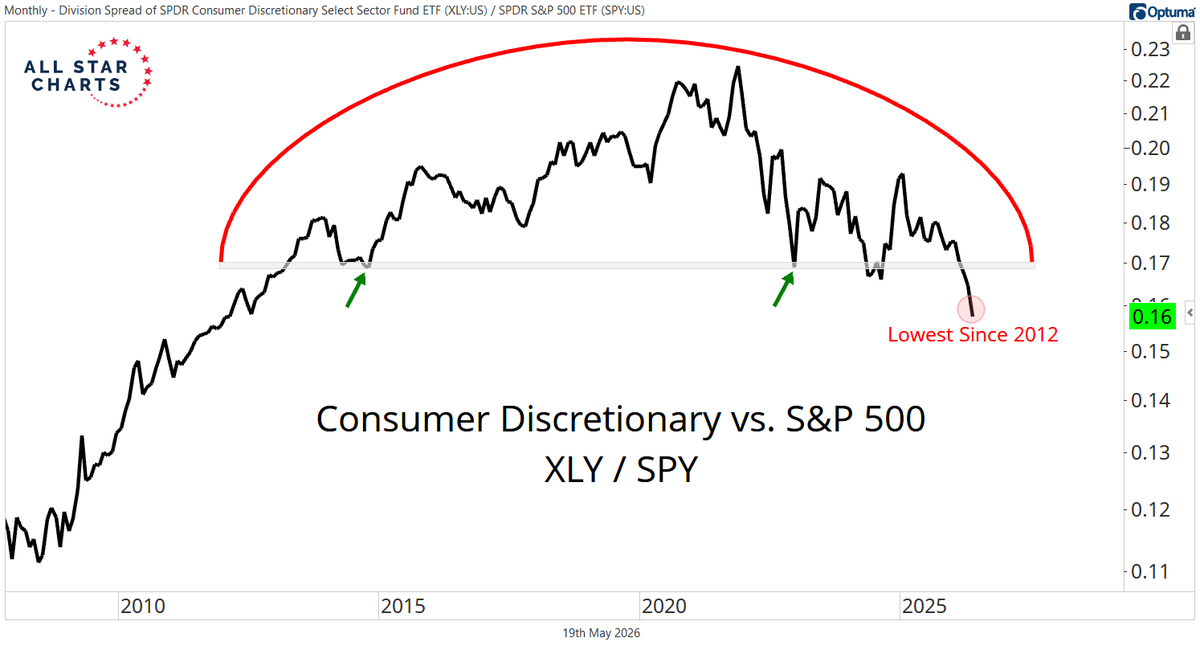
Consumer Discretionary has resolved a massive top relative to the S&P 500.
See the full post from Sam Gatlin.
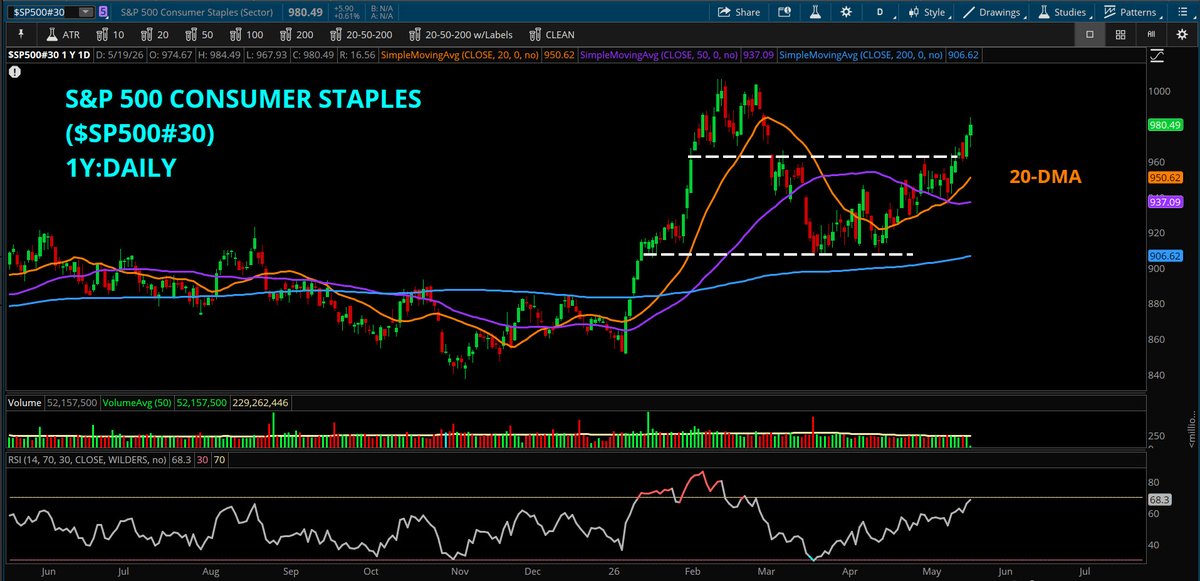
Consumer Staples are breaking out of a multi-week base.
Examine the whole tweet from Kevin Horner.
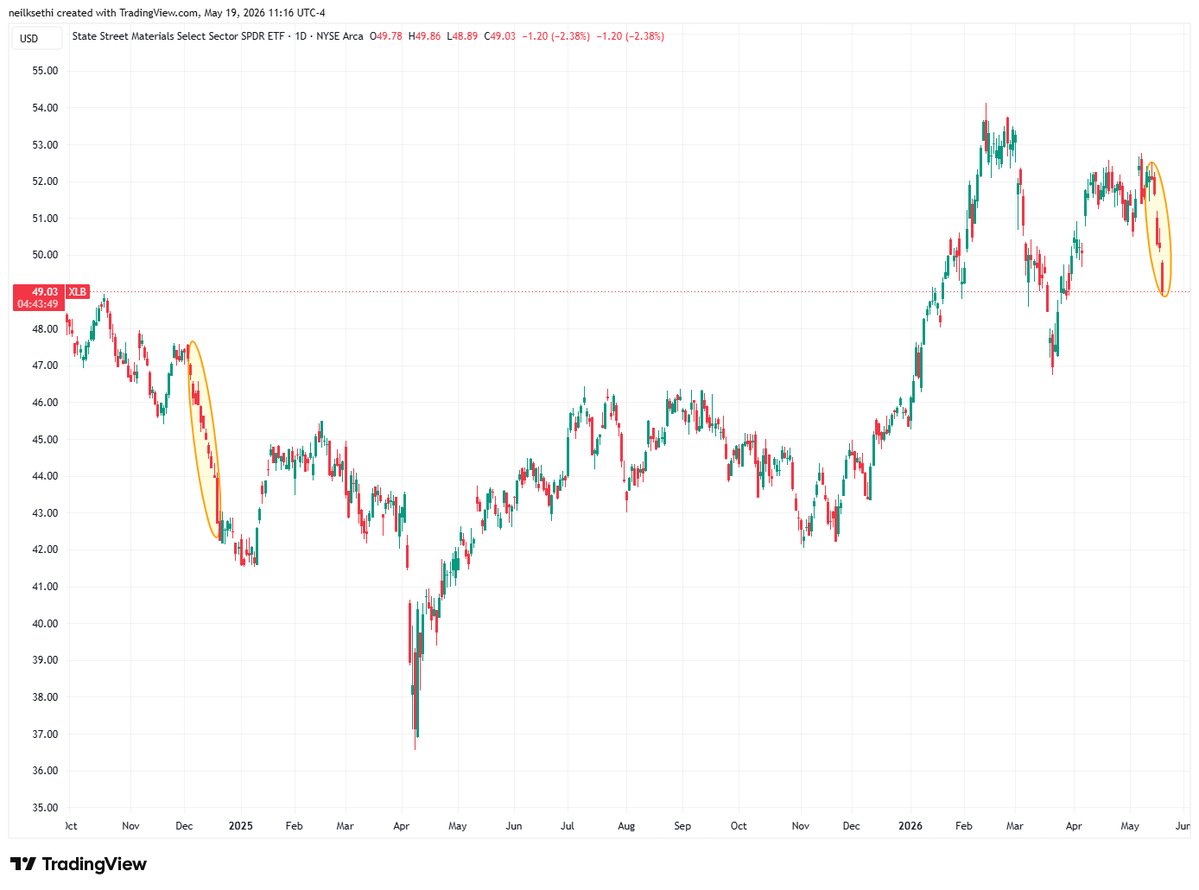
The Materials Sector closed lower for the sixth-straight session, its longest losing streak since Dec 2024.
Check out the complete post from Neil Sethi.
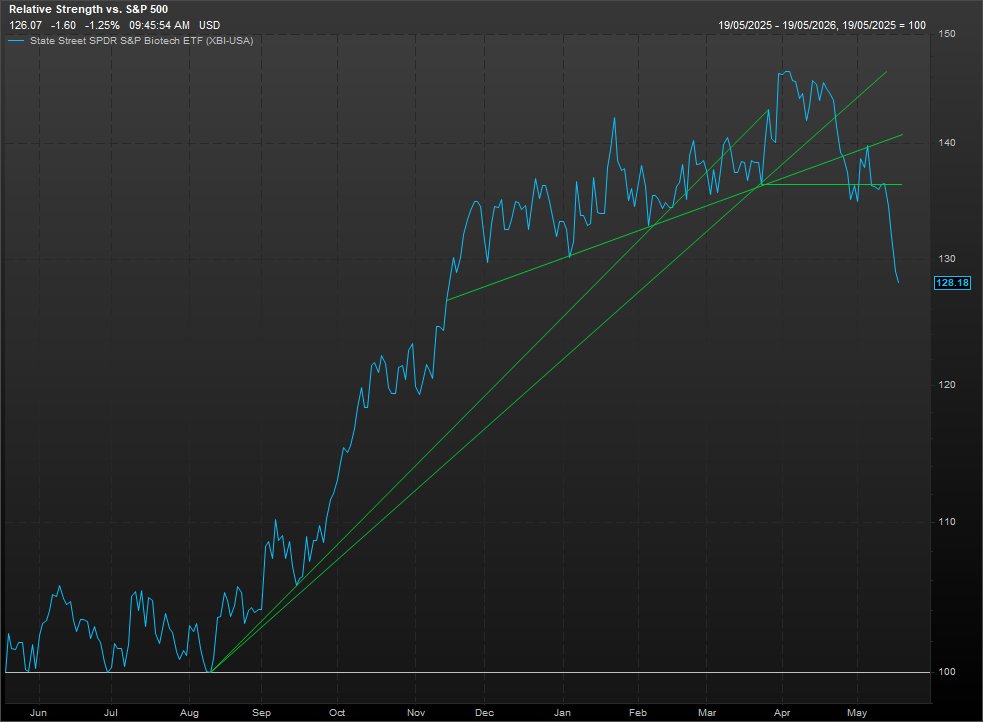
Biotech relative to the S&P 500 has slipped to fresh seven-month lows.
View the whole tweet from David Nicoski.
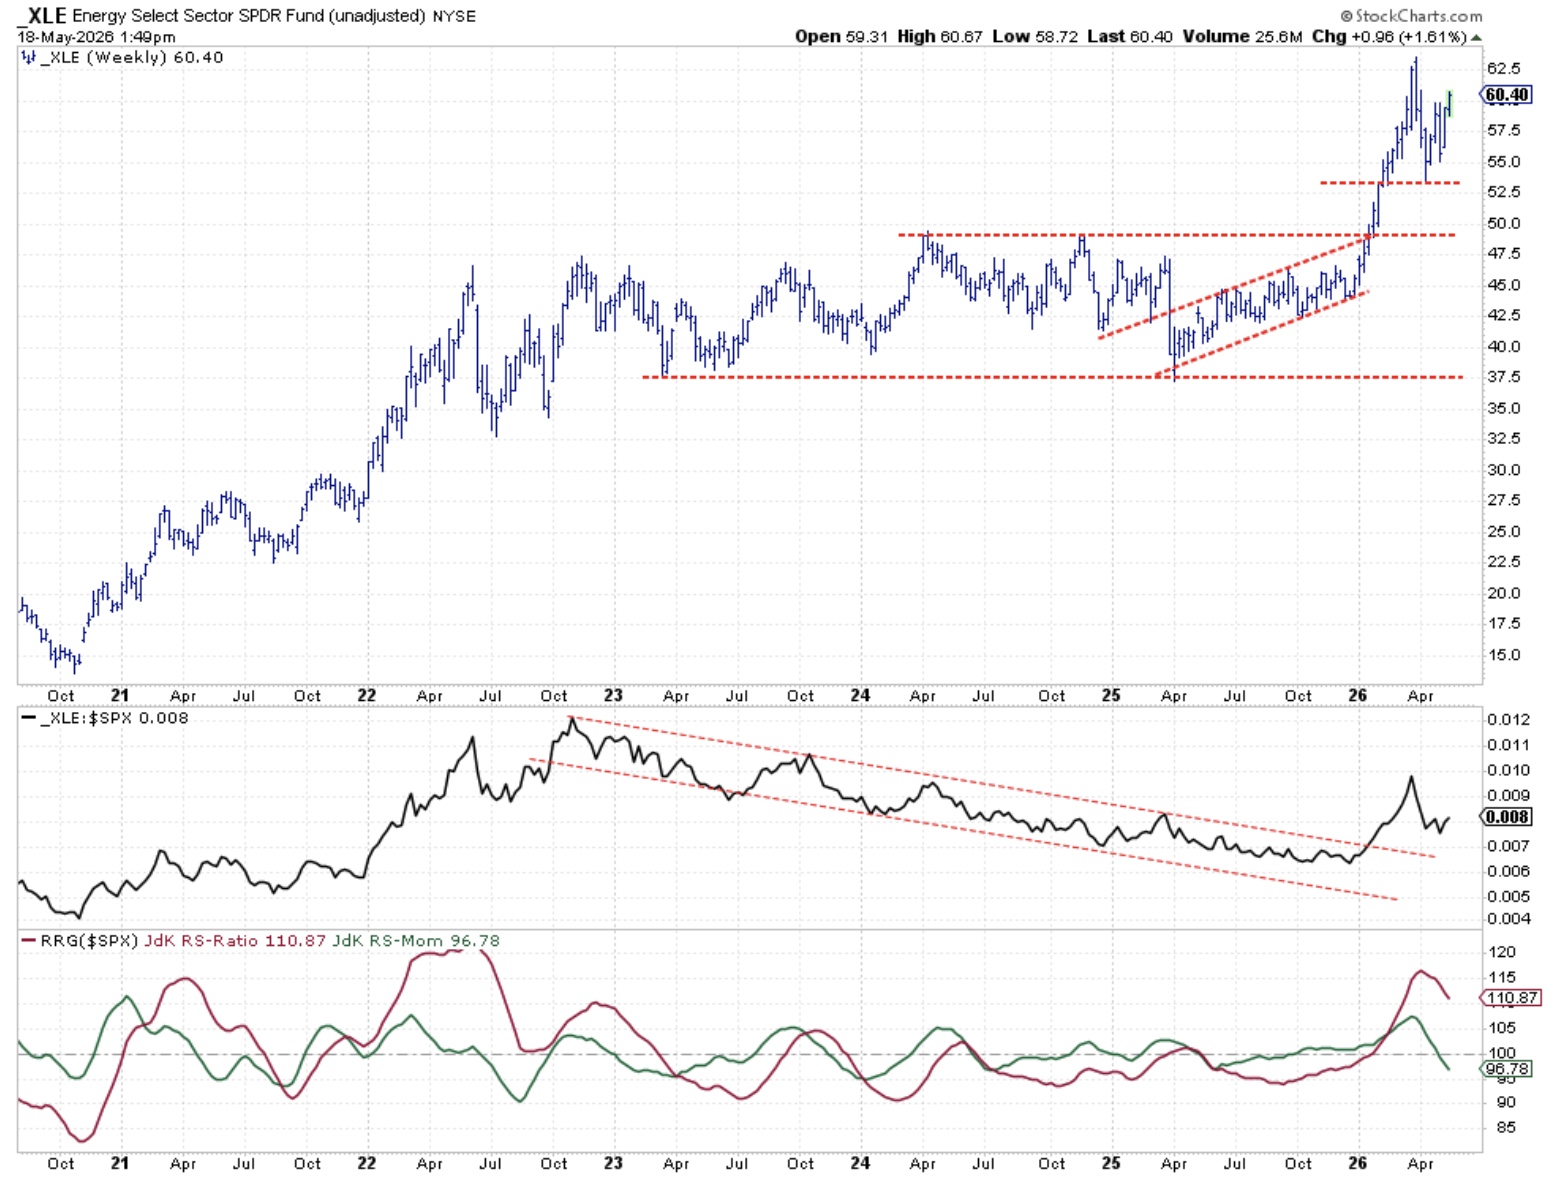
The Energy sector is pushing above its prior highs from late April / early May, while relative strength has started to improve.
Read the full article from Julius de Kempenaer.
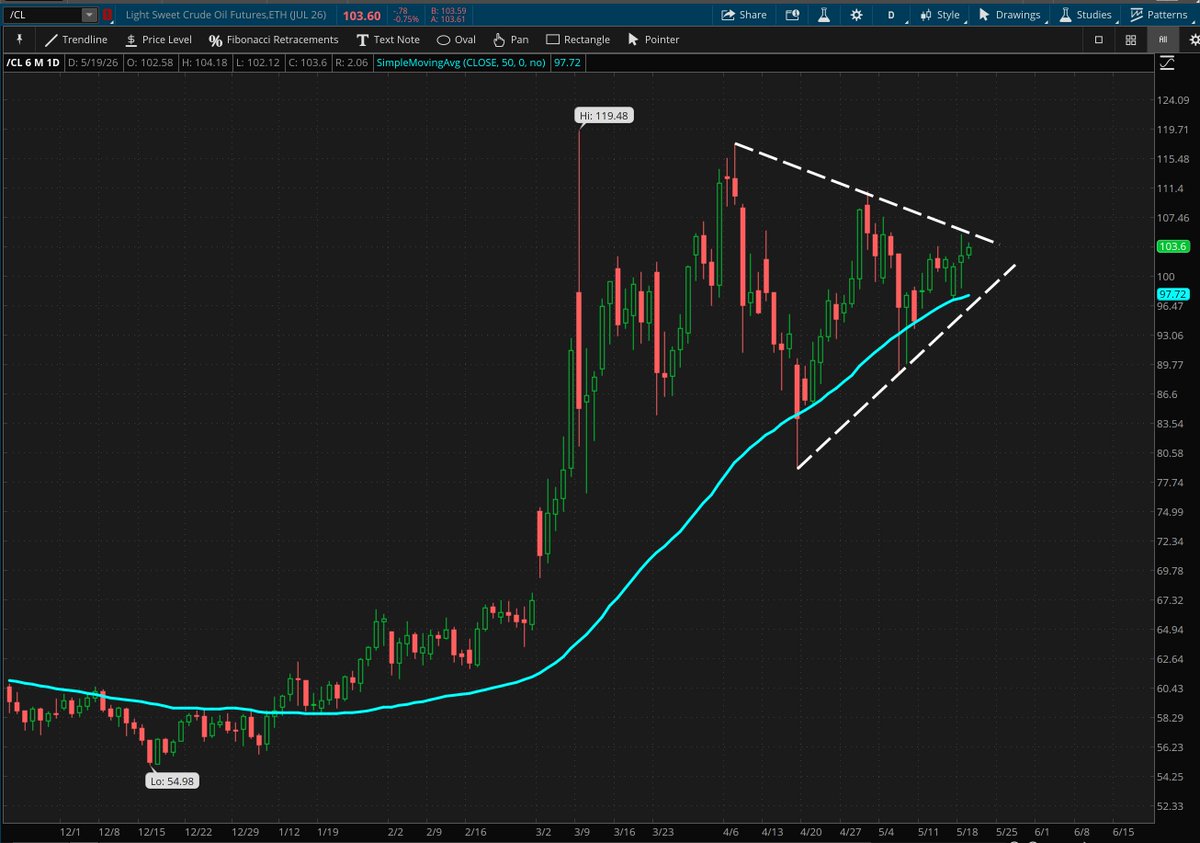
Crude Oil is approaching the apex of its symmetrical triangle.
See the entire tweet from Rachel Dashiell.
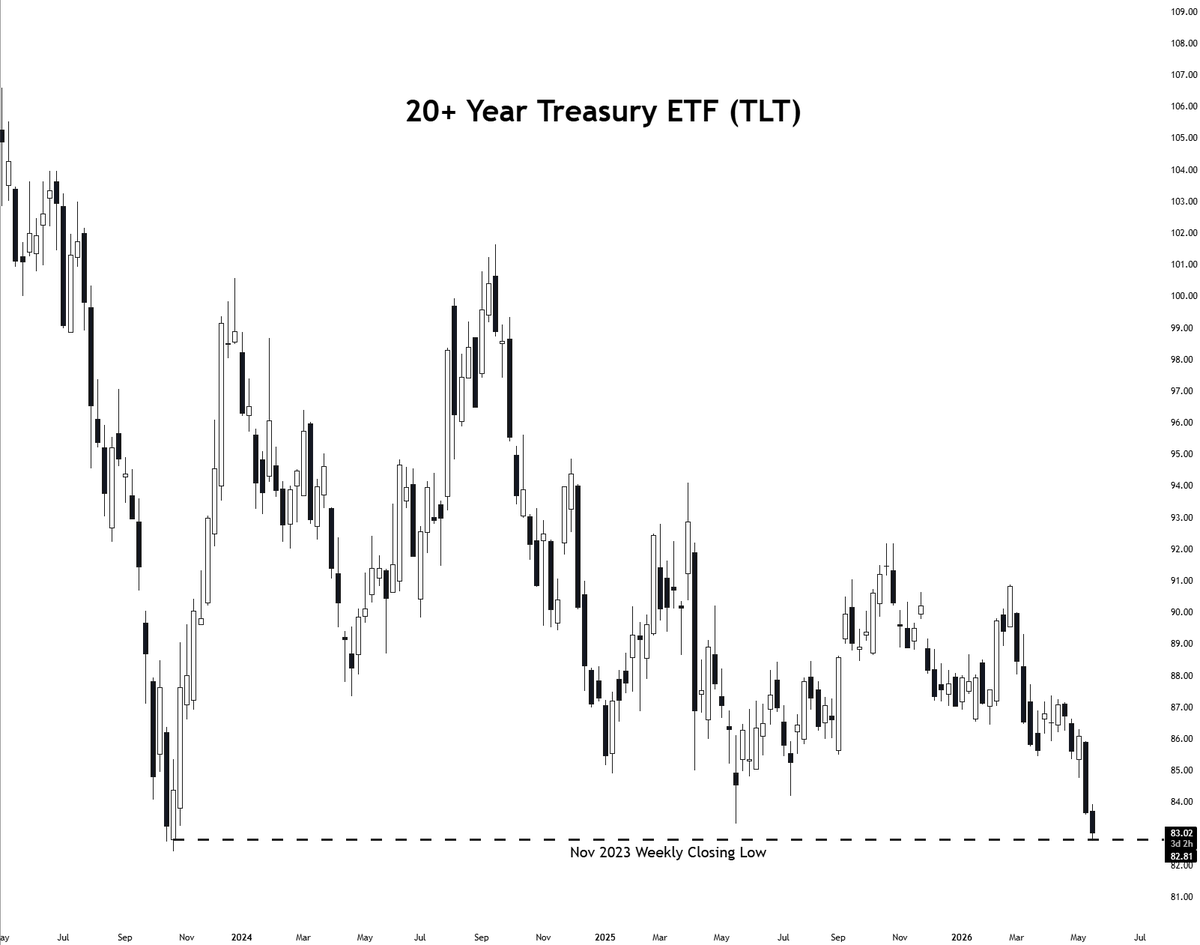
20+ year Treasury bonds are back at the November 2023 lows.
Check out the complete post from Wall Street Wingman.
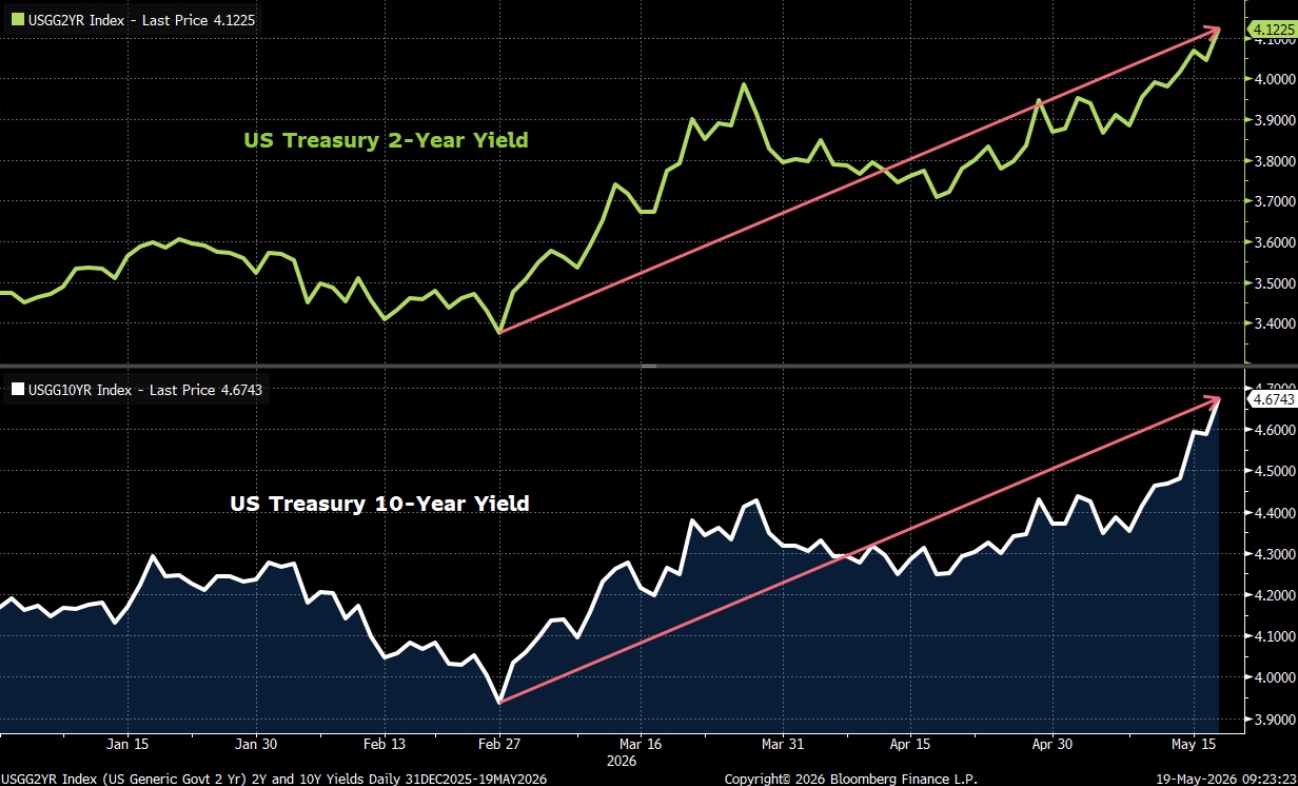
A 4.12% 2-year yield suggests investors expect short-term interest rates to average above current policy levels over the next two years.
Read the full analysis from Sonu Varghese.
The Chart Report curates best-in-class technical analysis from across the web.
If you’d like to share a chart or just say hello, email us at [email protected]