Biotech Builds Momentum After Months of Digestion 📈 The Chart Report

Chart of the Day
🏆 Today's Chart of the Day was shared by Dan Marchese.
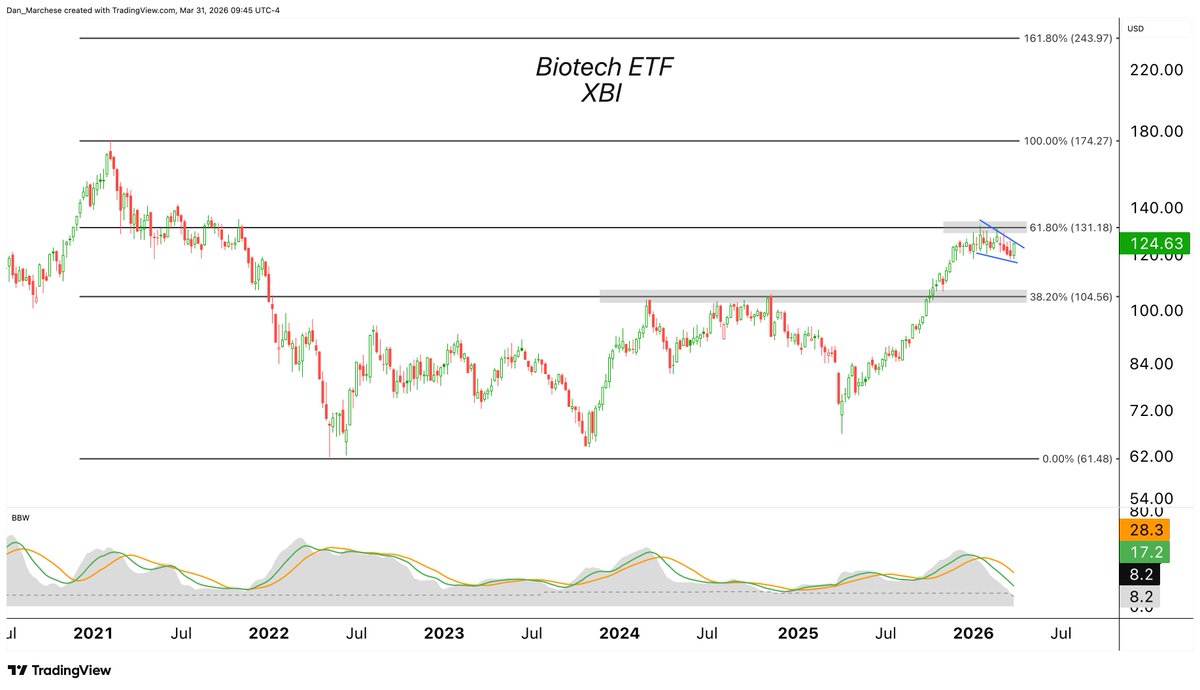
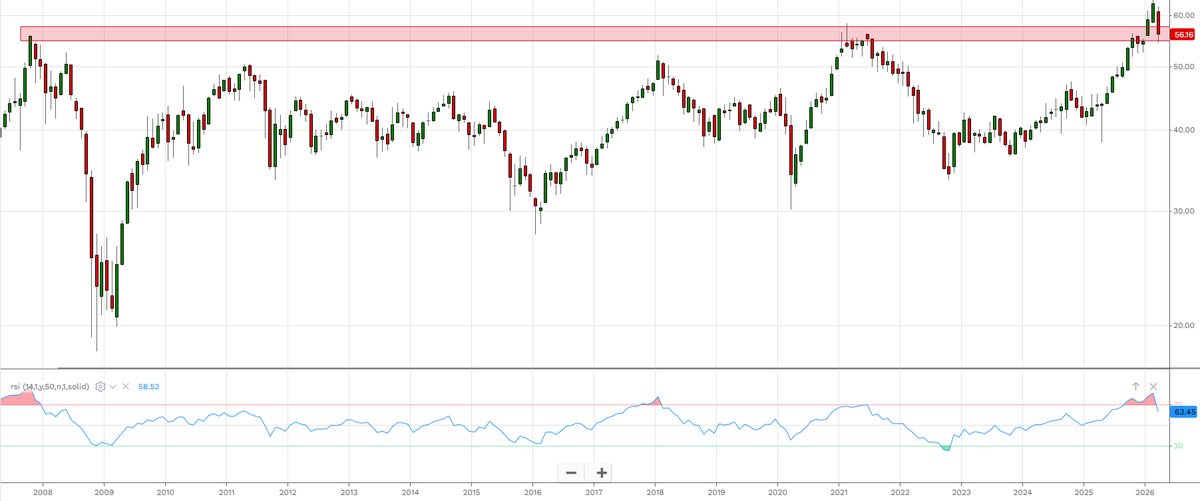
Just two days into the week, the Biotech ETF (XBI) is flashing a big bullish engulfing candle as it attempts to engulf a four-week down-streak.
After breaking out from a multi-year base last October, biotech has been consolidating just beneath the 61.8% retracement level, quietly setting the stage for its next move.
Volatility is also compressed to some of the lowest levels in years, and a decisive breakout could spark sustained upside momentum as biotech is already making new multi-year highs relative to the S&P 500.
The Takeaway: Biotech has been digesting its gains following last year's breakout, with price holding near key Fibonacci resistance and a breakout looking increasingly plausible.
More Great Charts
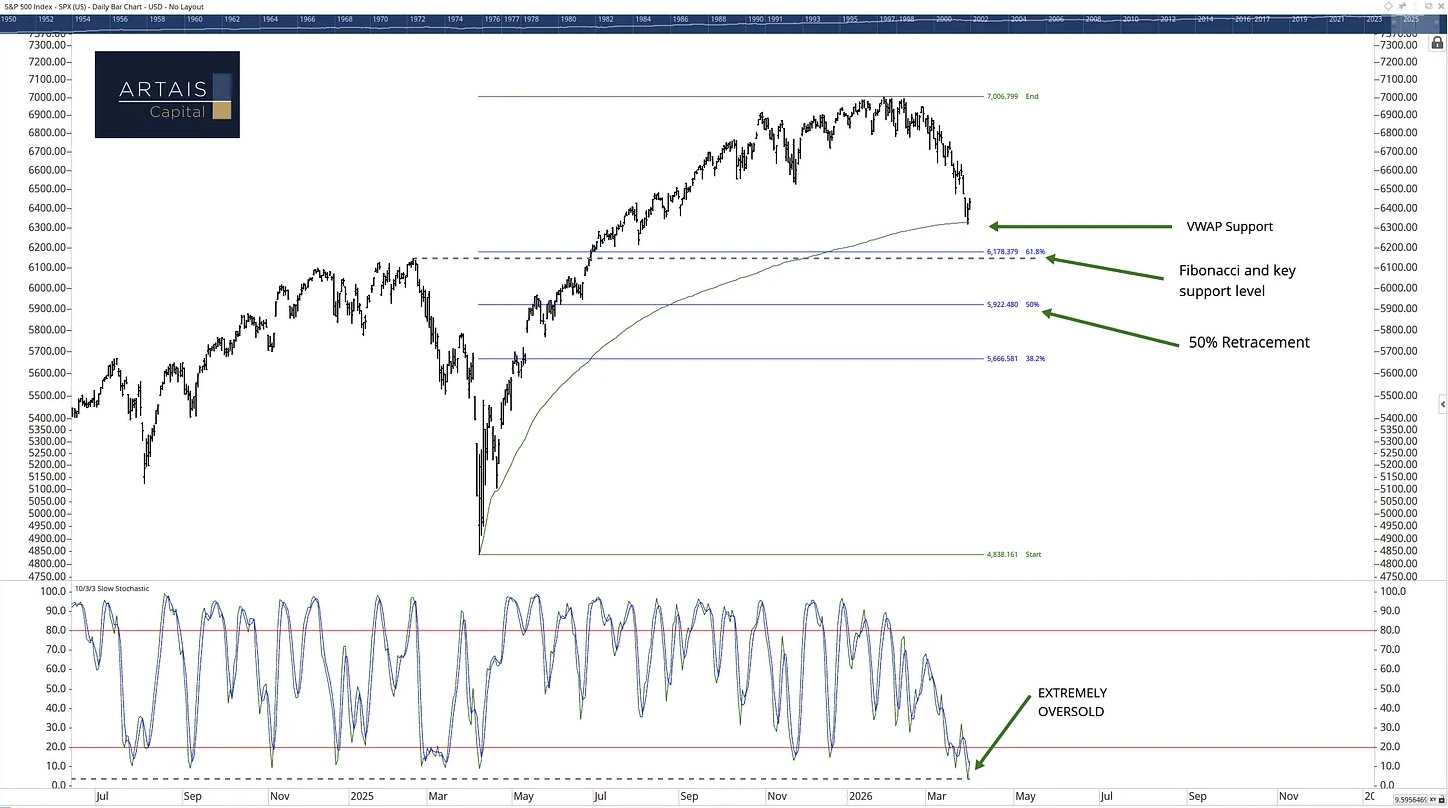
The S&P 500 has pulled back into a notable level of interest with the slow stochastic being extremely oversold.
Read the complete analysis from John Rothe.
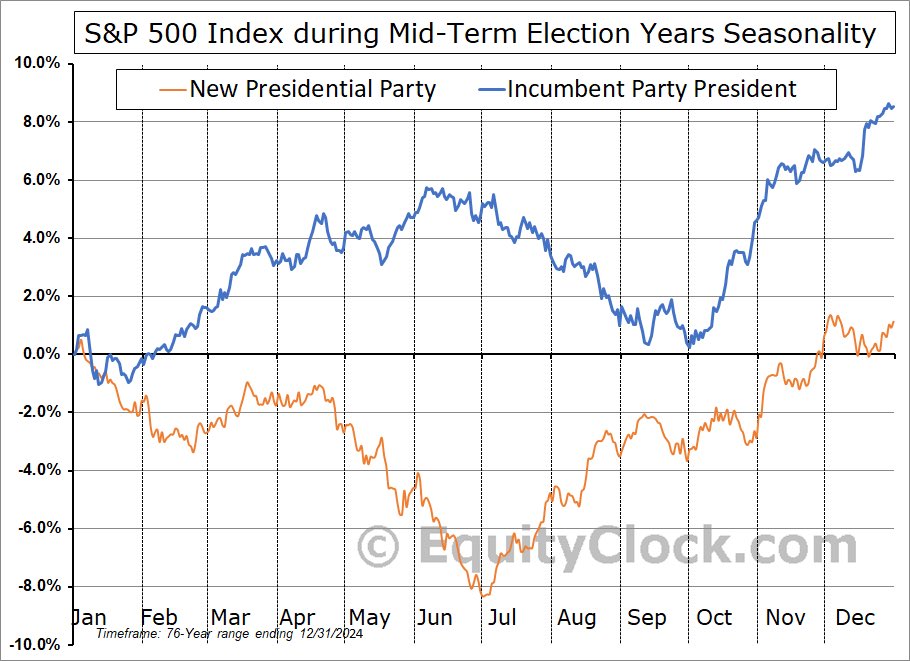
During mid-term election years, the second quarter tends to be the weakest, except when there is an incumbent president in office.
View the full post from Equity Clock.
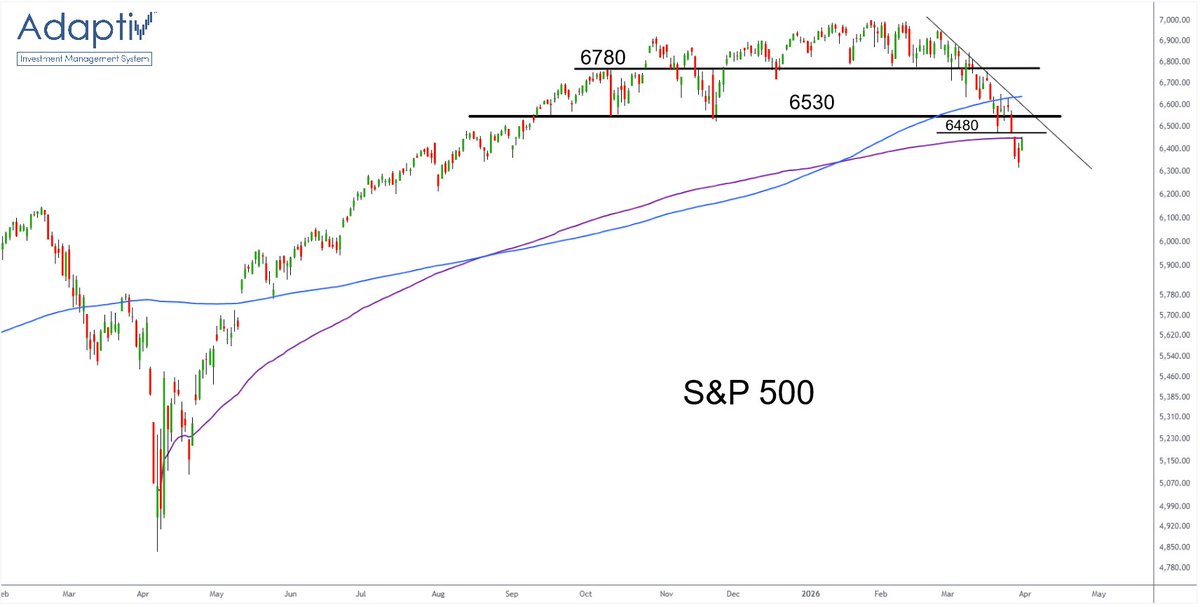
The S&P 500 needs to clear 6780–6800 before the uptrend can get back on track, with several resistance levels standing in the way first.
See the entire tweet from Ian McMillan.
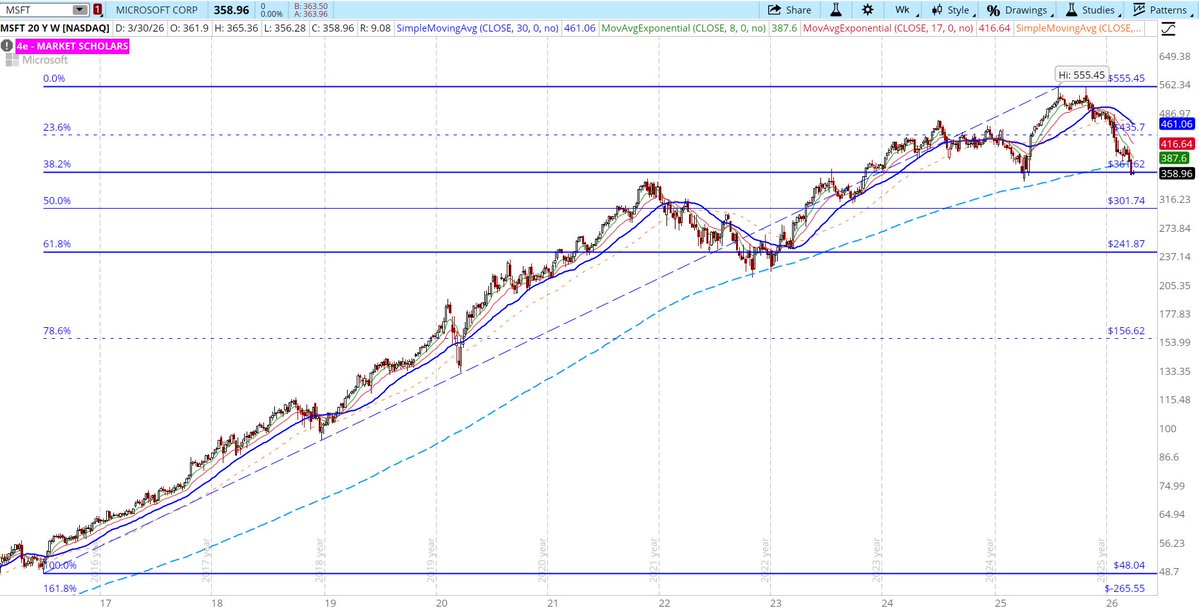
Microsoft has become the first Mag Seven stock to break below its 200-week SMA.
Examine the full post from David Settle.
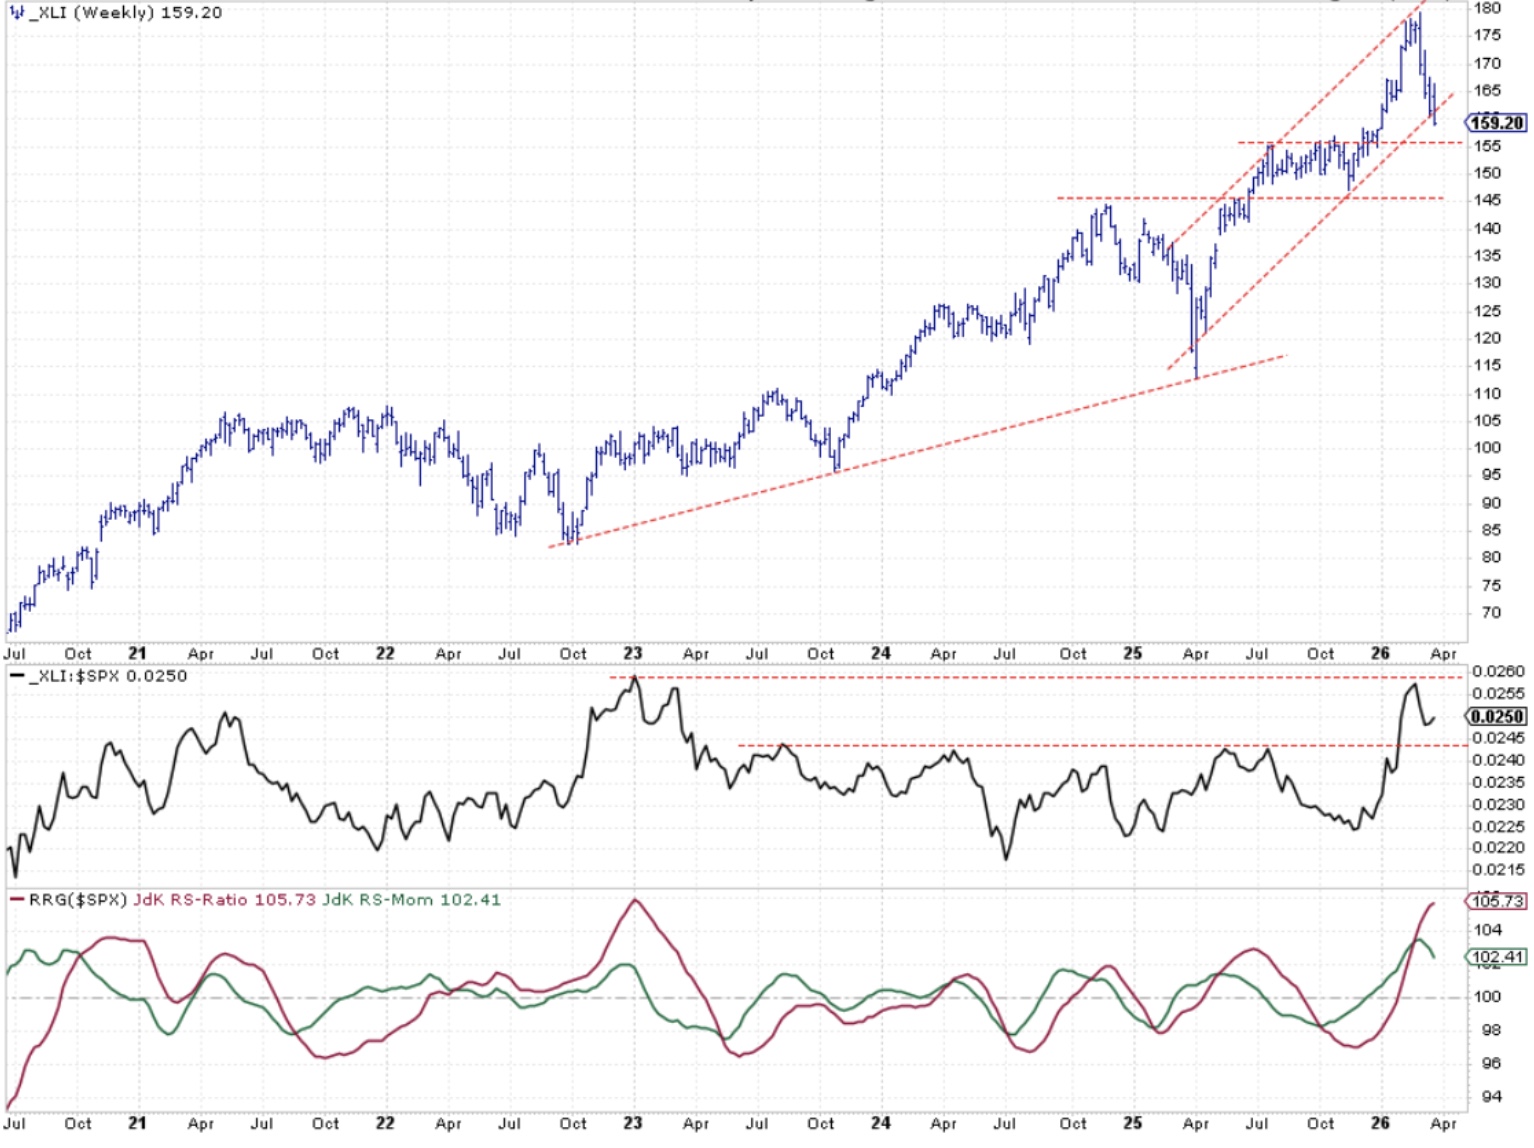
Industrials are finding support near the lower edge of their rising channel, and pushing past the 2023 high in relative strength would confirm the uptrend.
Explore the complete article from Julius de Kempenaer.
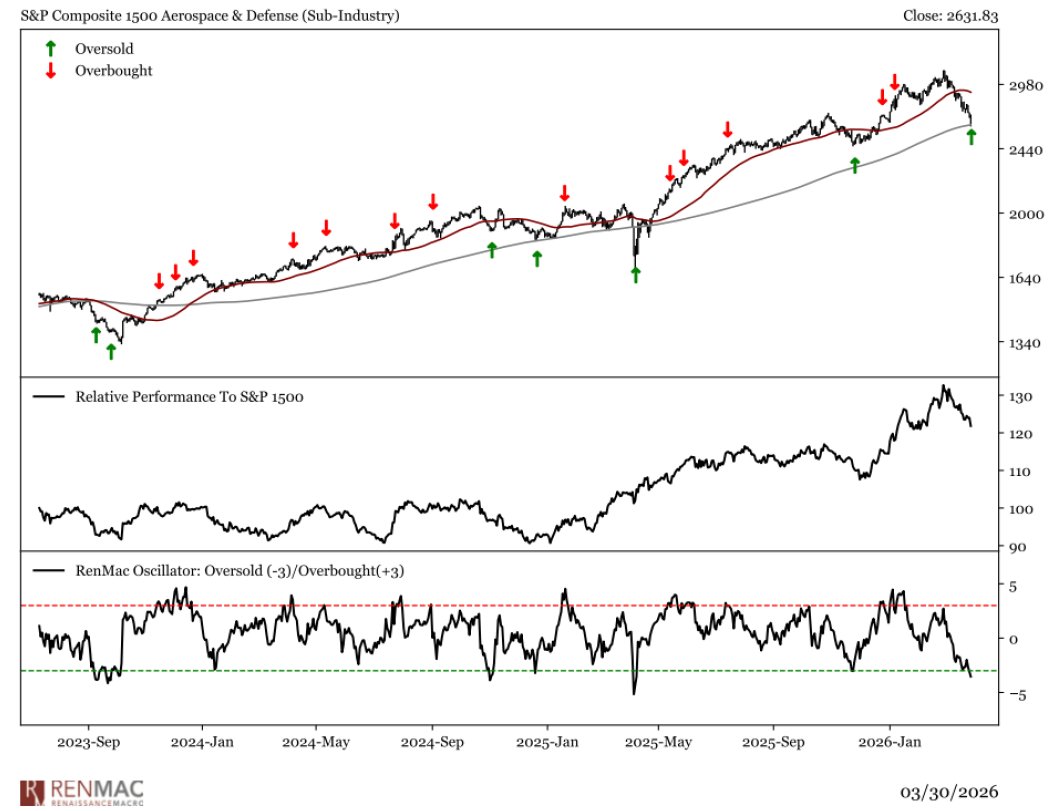
Aerospace and Defense names are now oversold in a well-defined uptrend.
Check out the whole tweet from RenMac.
The Emerging Markets ETF is revisiting its 2007 highs following its second-highest monthly-RSI reading on record.
View the full tweet from Stephen Weitzel.
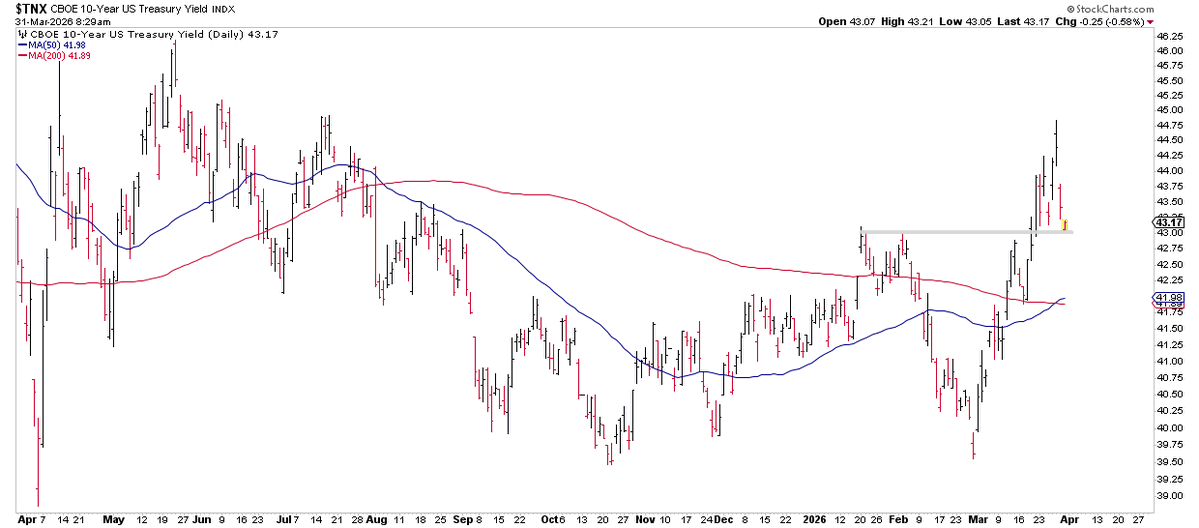
The U.S. 10-year Yield has pulled back to its breakout level.
See the entire post from David Rath.
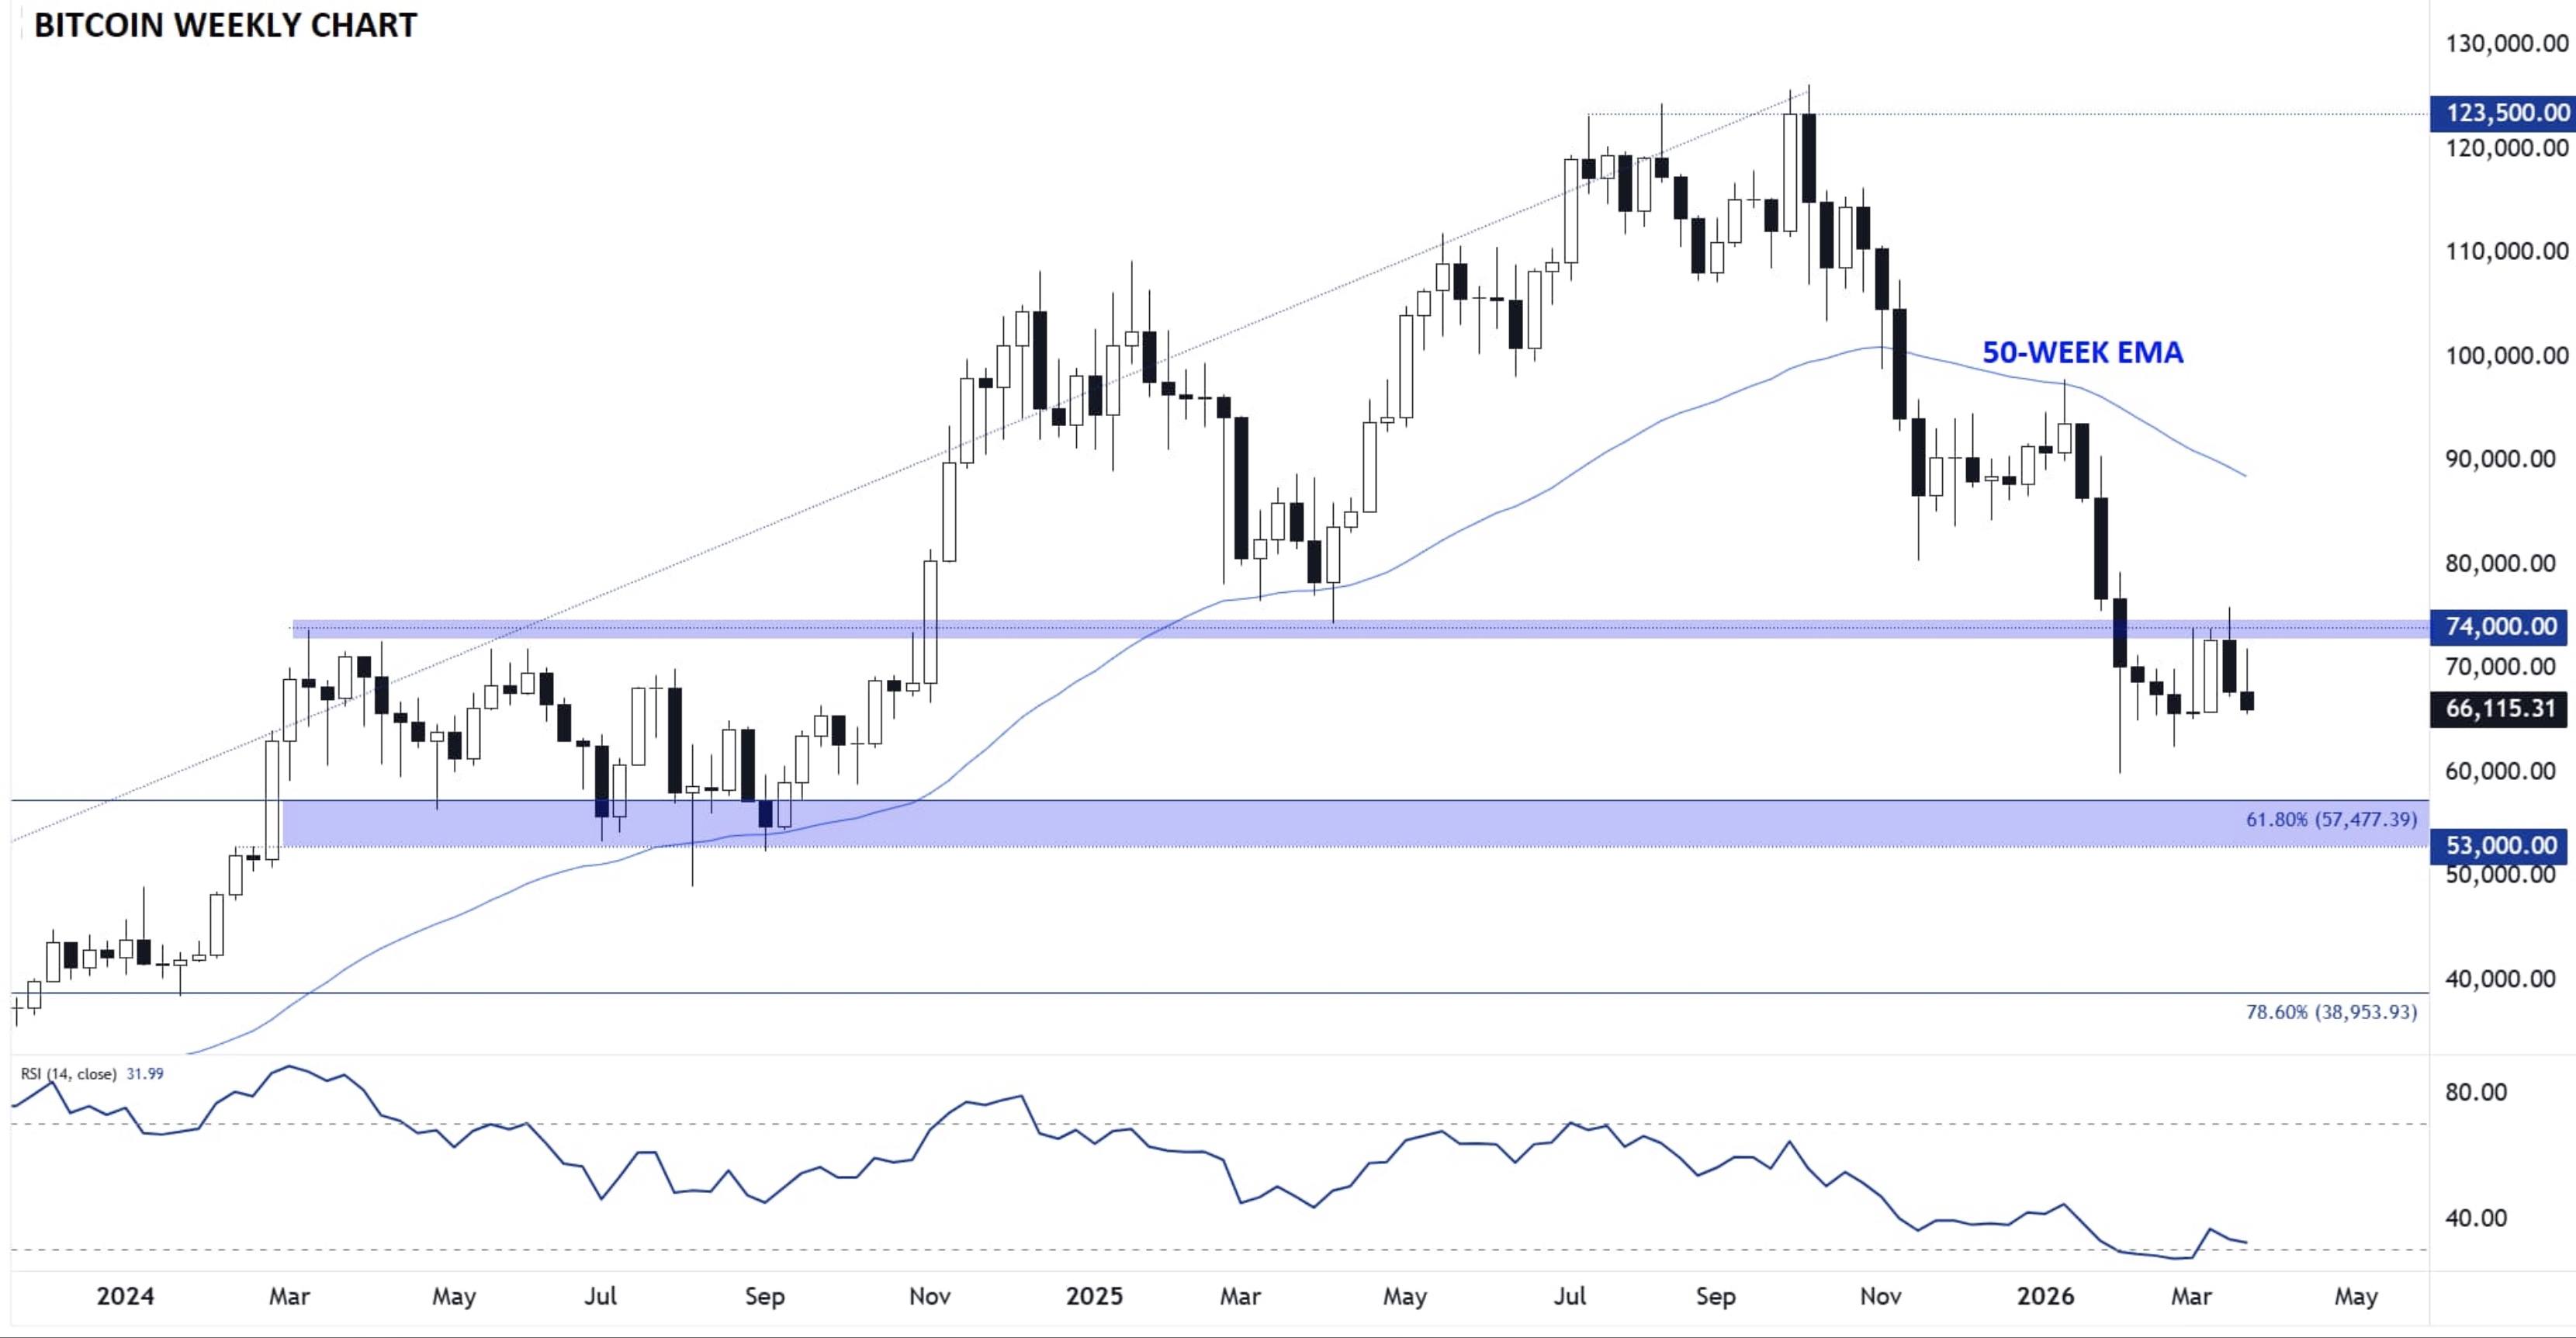
Bitcoin would need to clear $74K to signal a potential reversal, but for now it remains in a downtrend from its October 2025 high.
Read the complete report from Matt Weller.
The Chart Report curates best-in-class technical analysis from across the web.
If you’d like to share a chart or just say hello, email us at [email protected]