Credit Is Starting to Crack 📈 The Chart Report

Chart of the Day
🏆 Today's Chart of the Day was shared by Jim Carroll.
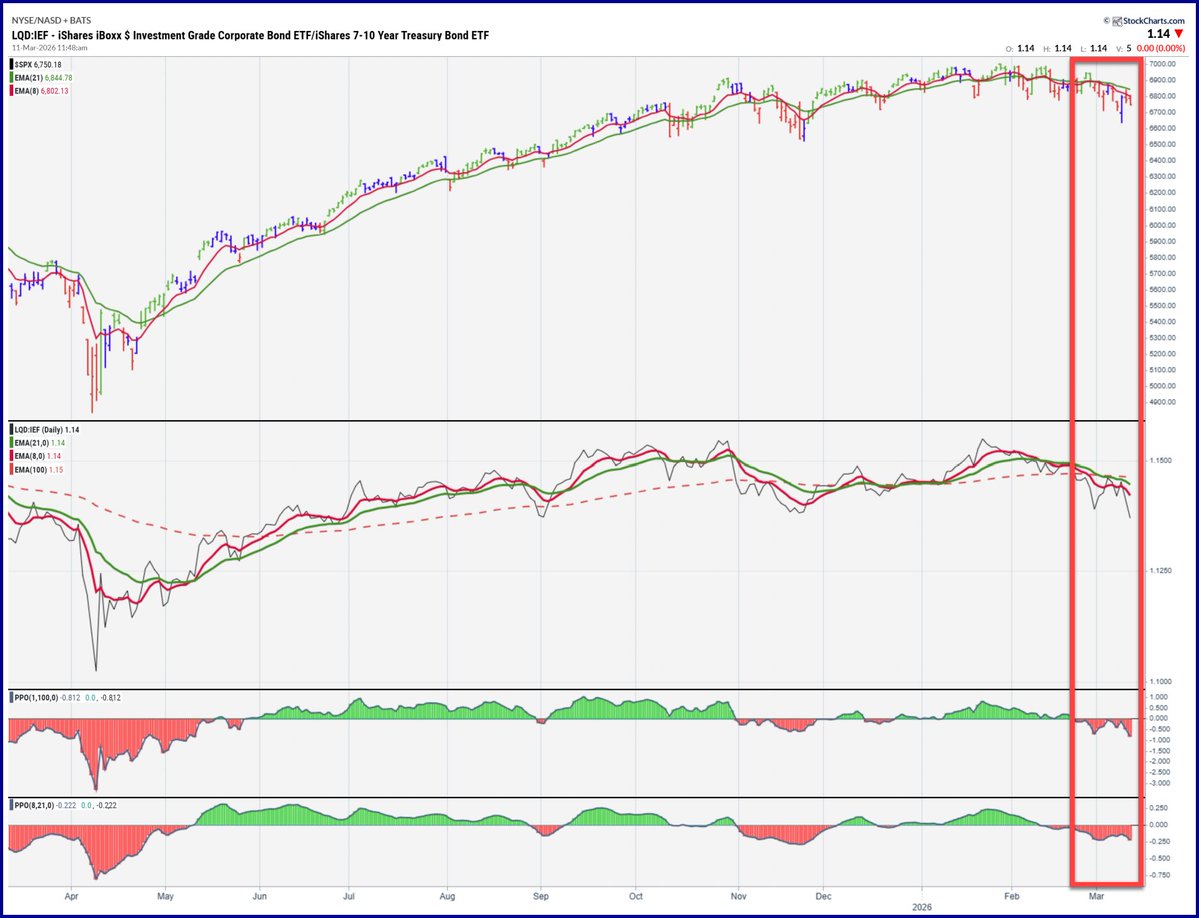
Investment Grade Corporate Bonds relative to 7–10 Year Treasuries (LQD/IEF) made new multi-month lows today and suffered its third-worst session since last Halloween.
When Treasuries begin to outperform corporate credit, it marks a shift toward safety and away from risk.
This suggests credit spreads are widening and financial conditions are tightening, which tends not to be the best environment for equities.
The Takeaway: Credit spreads are widening, and if the trend persists, it’s likely to act as a headwind for risk assets.

More Great Charts
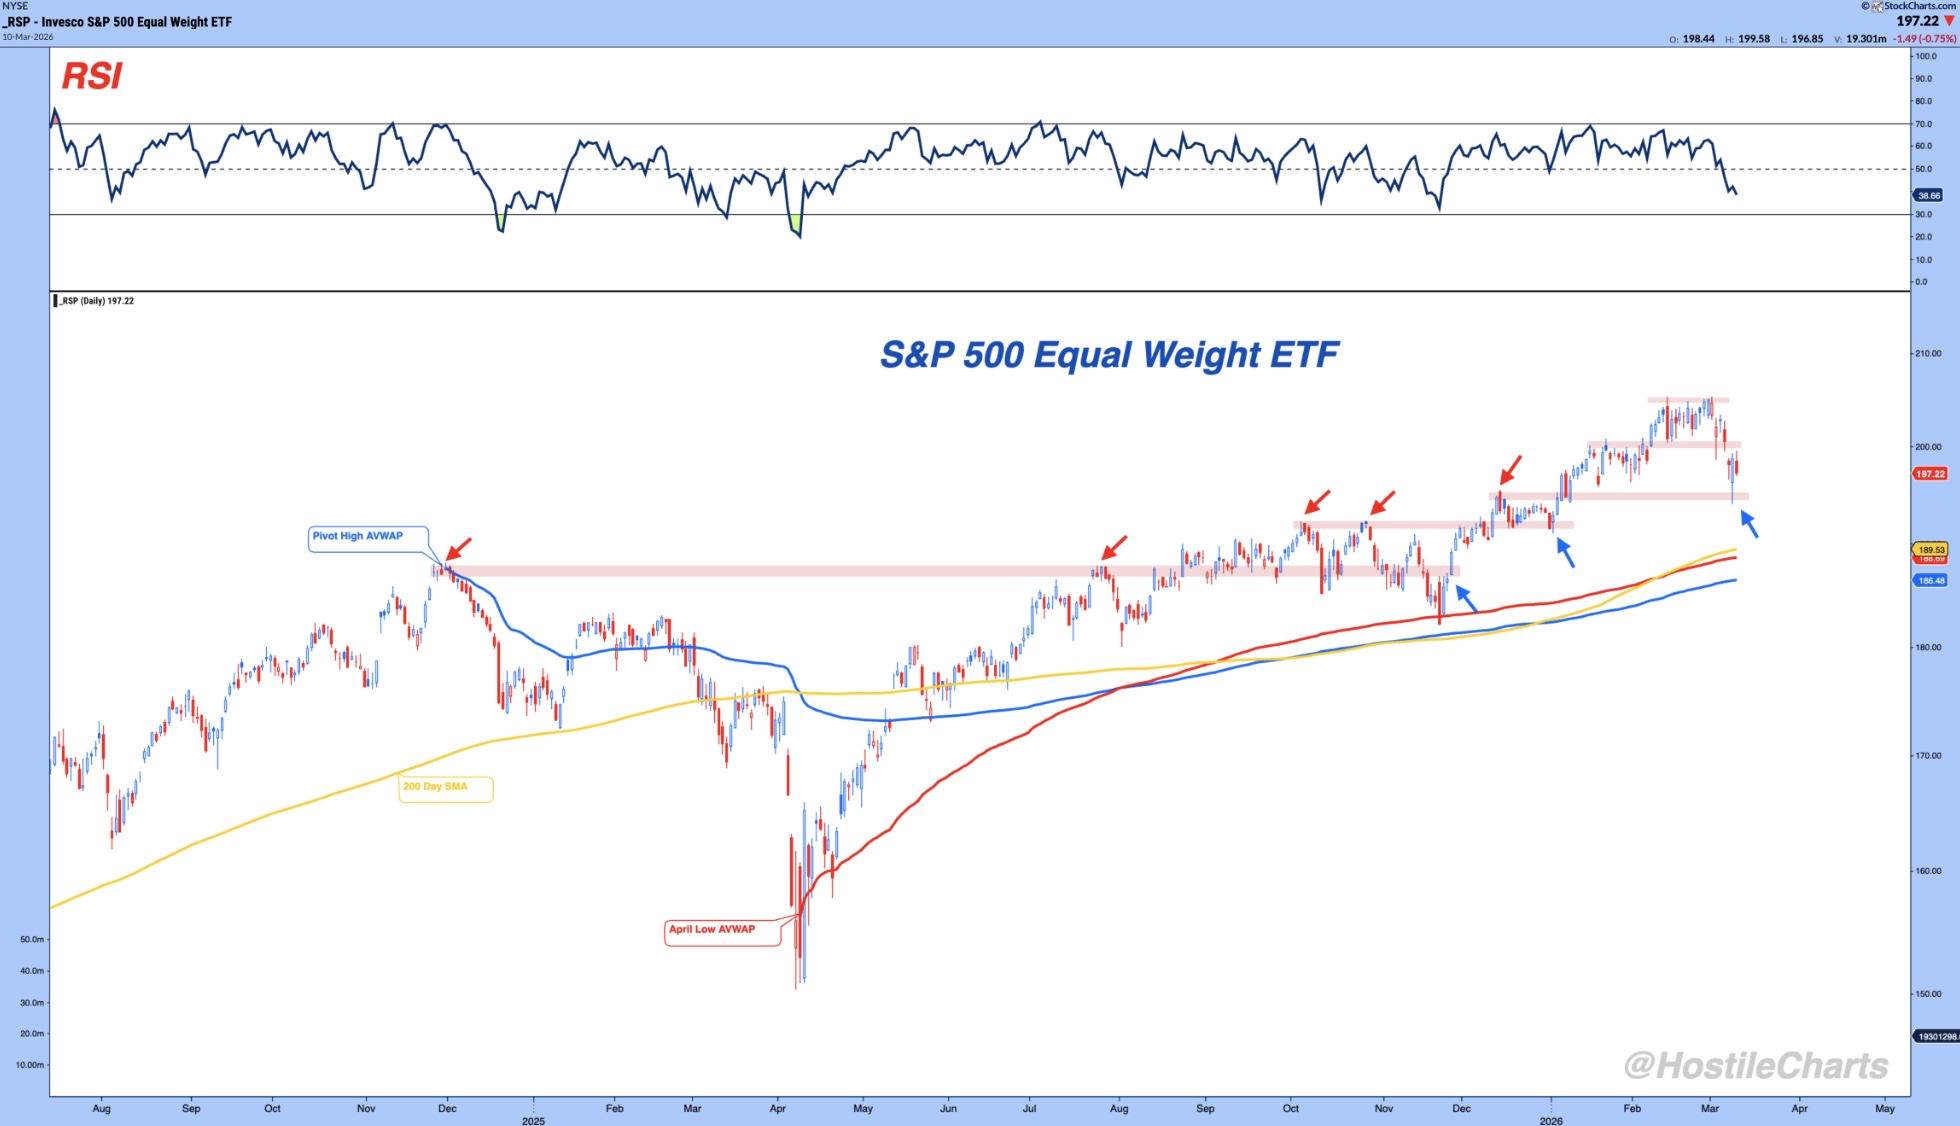
Price remains trapped in “No Man’s Land,” showing no clear conviction in either direction.
Access the full article from Larry Thompson.

The percentage of S&P 500 stocks trading above their 20-day moving averages has dropped to its lowest level since last April.
View the entire post from NextBigTrade.

The Mag Seven relative to the S&P 500 made lower lows into the end of February, but momentum held a higher low — a classic bullish divergence.
Read the complete analysis from JC Parets.

The Financial Sector relative to the S&P 500 is sitting at over decade-long support.
See the whole tweet from Jack.
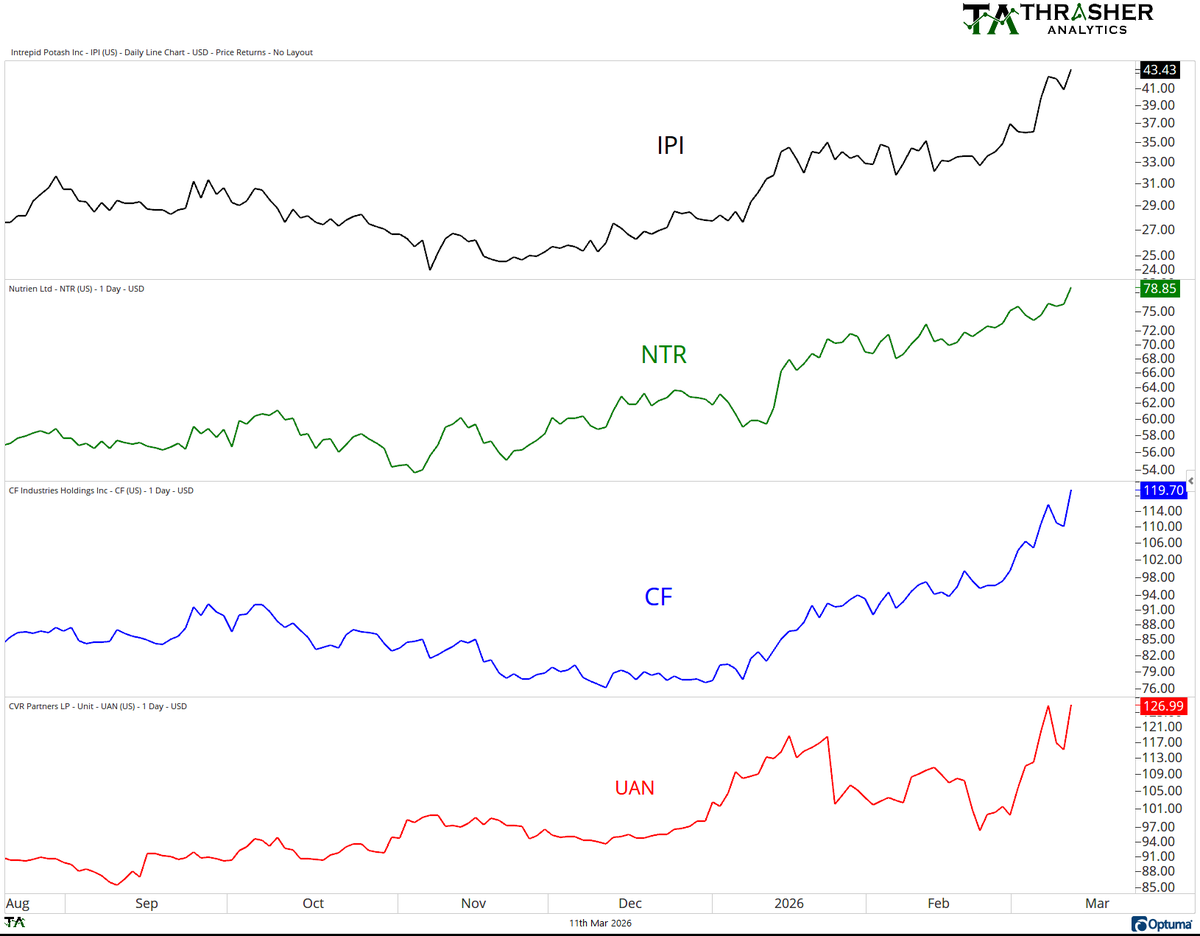
Fertilizer stocks are making new multi-year highs.
Check out the full post from Andrew Thrasher.
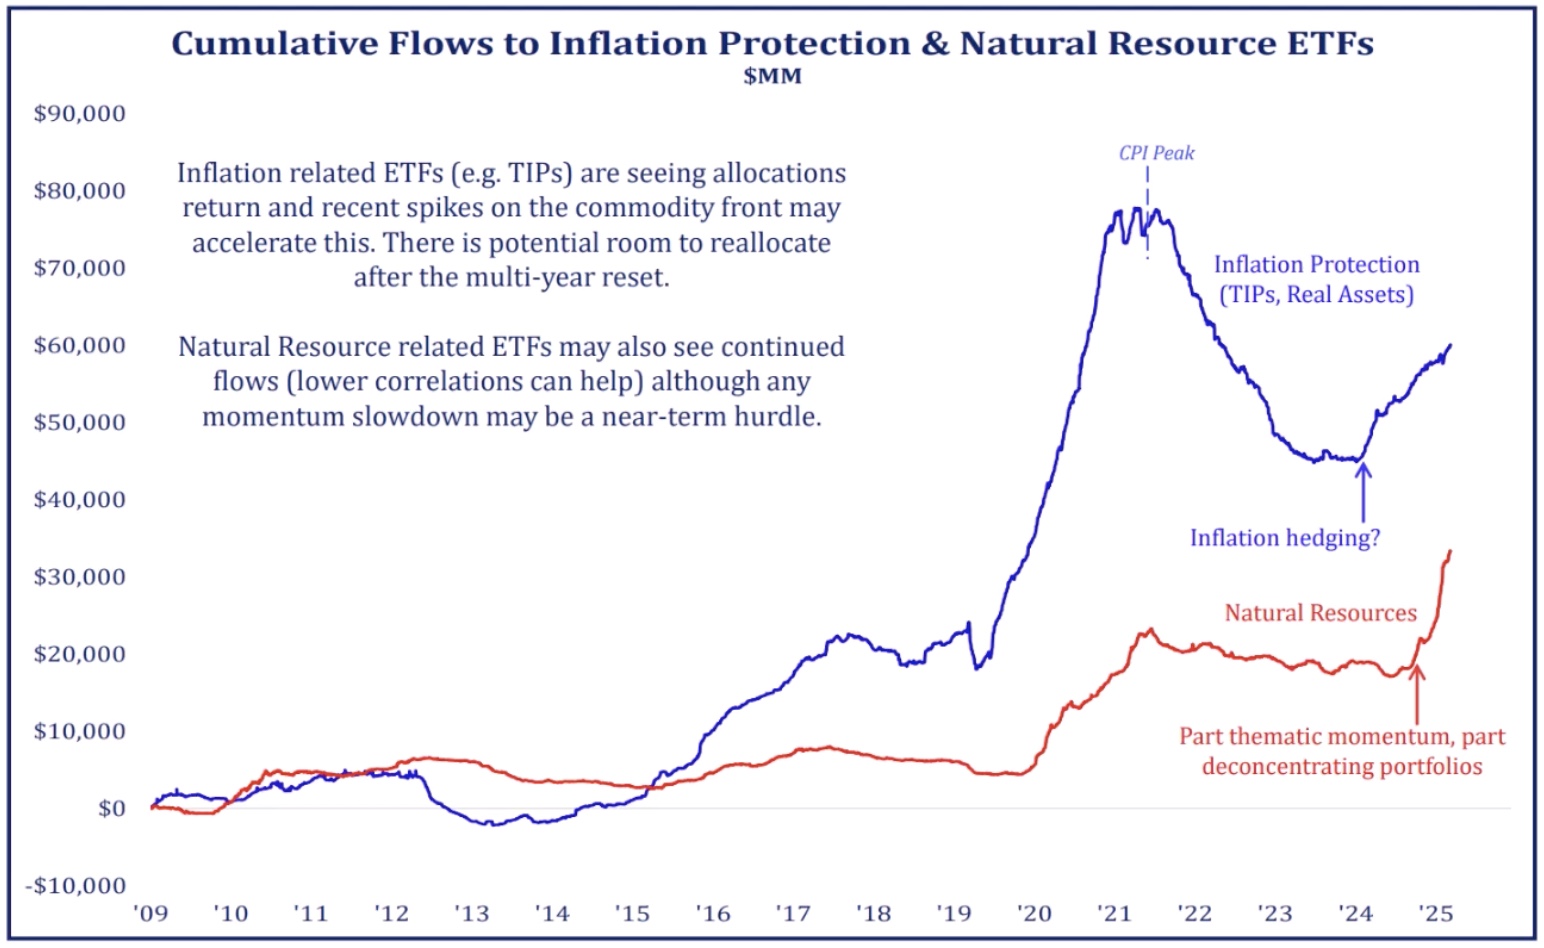
We’re seeing an uptick in cumulative flows into inflation protection and natural resource ETFs.
Catch the latest ETF breakdown from Todd Sohn.

So far, the current inflation cycle is tracking closely with the 1966-1986 cycle.
View the entire tweet from Cycle Strategy.

High Yield Corporate Bonds have dropped in 8 of the last 10 sessions, and have broken below $80 support.
See the whole tweet from John Roque.
The Chart Report curates best-in-class technical analysis from across the web.
If you’d like to share a chart or just say hello, email us at [email protected]