Seasonal Tailwinds Are Fading 📈 The Chart Report

Chart of the Day
🏆 Today's Chart of the Day was shared by Day Hagan Asset Management.
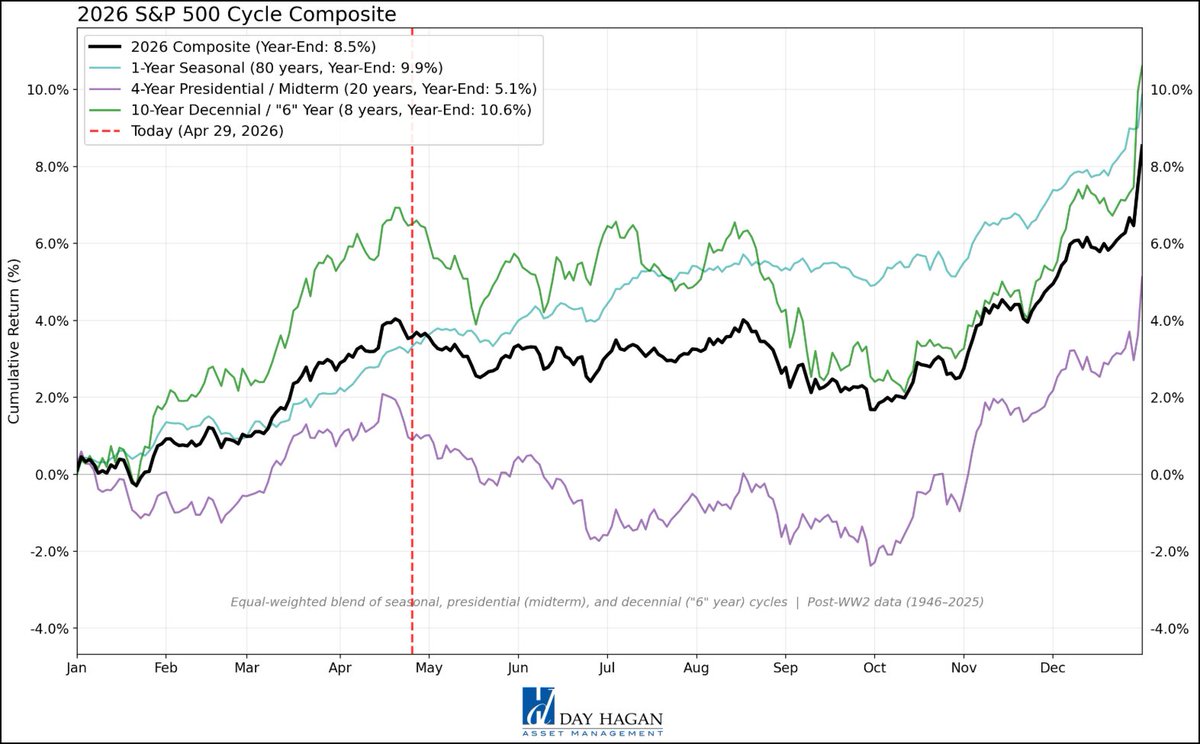
Cycle composites are flashing a warning, with both the decennial and presidential cycles historically topping out around this time of the year.
The data points to a prolonged stretch of chop through the summer months before conditions begin to improve into Q4.
With that being said, these cycles aren't meant to be taken as signals, and are better used as context rather than conviction.
The Takeaway: Seasonals are turning from tailwind to headwind, suggesting the potential for a tougher tape in the months ahead.
More Great Charts
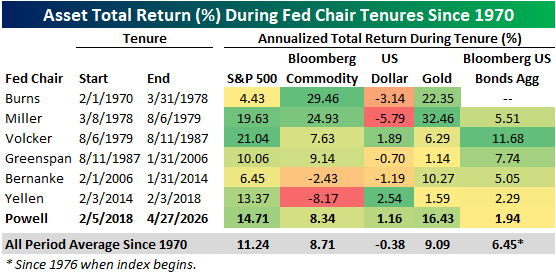
The S&P gained 14.7% annualized during Powell's term, the third best for Fed chairs since 1970.
View the full post from Bespoke.
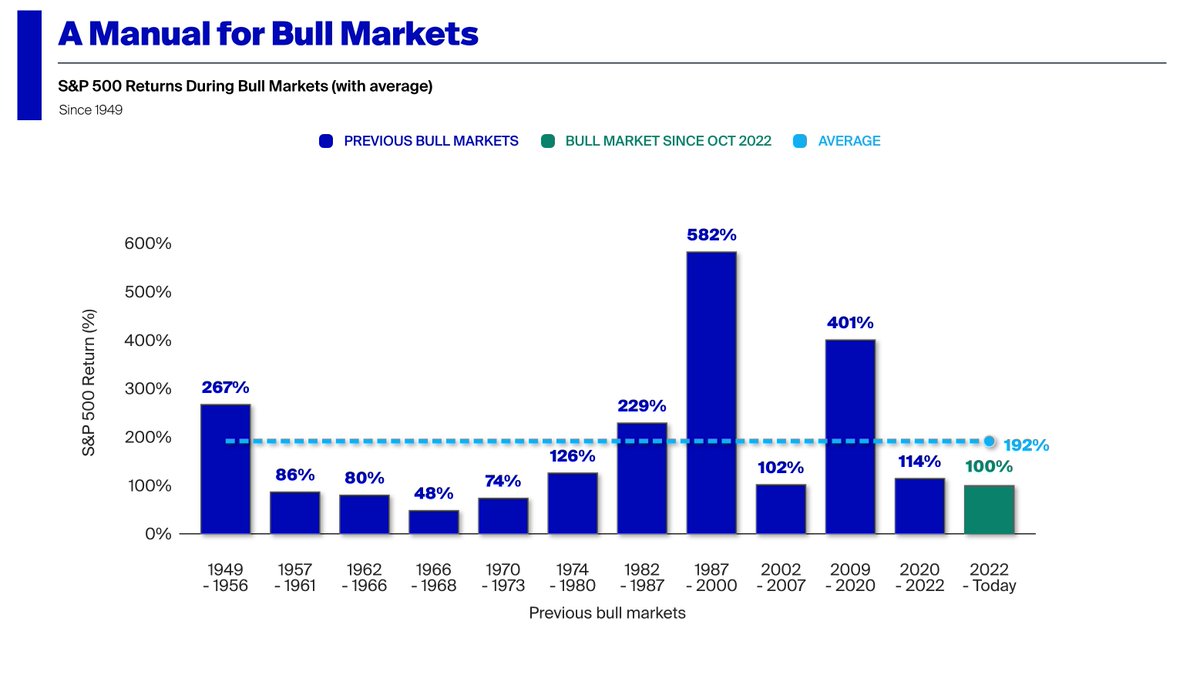
Since the market bottomed in October 2022, the S&P 500 has doubled, marking the seventh-strongest bull market since 1949.
See the entire tweet from Phil Rosen.
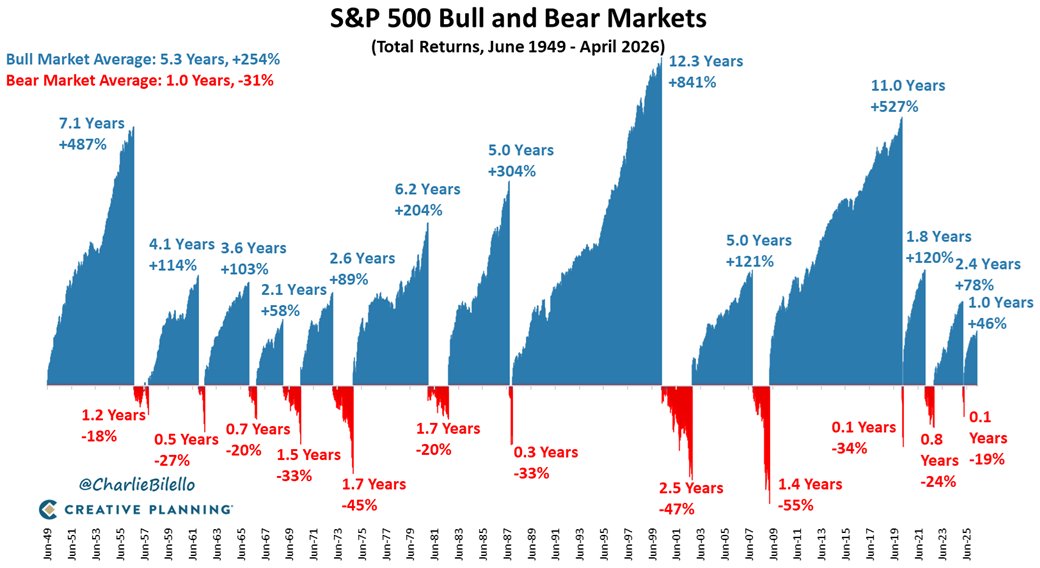
Bear markets are dwarfed by bull markets in both magnitude and duration.
Examine the full post from Peter Mallouk.
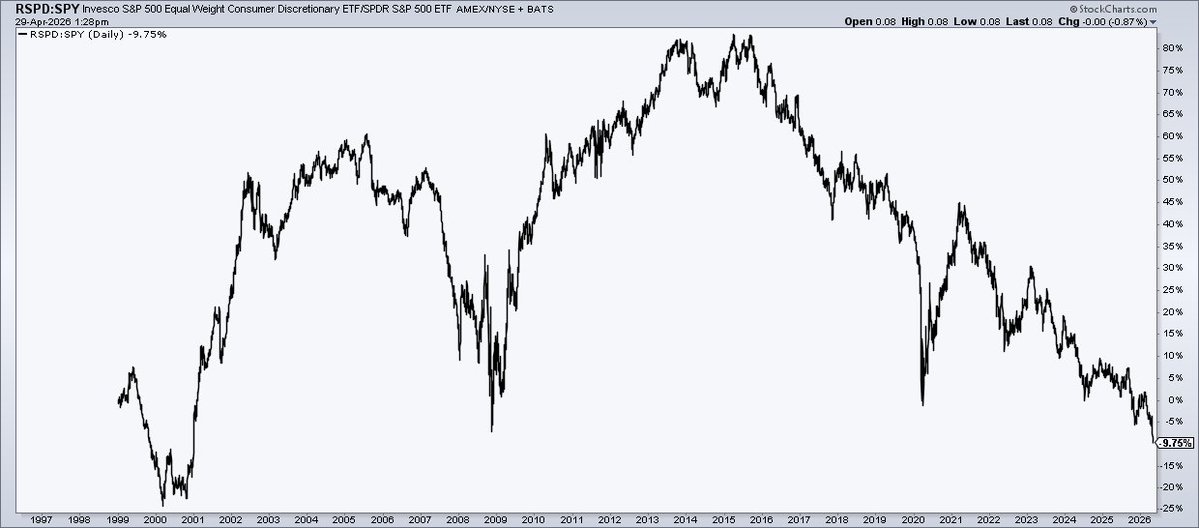
Equal-weight Consumer Discretionary relative to the S&P 500 has fallen to its lowest levels since 2000.
Read the full article from Mike Zaccardi.
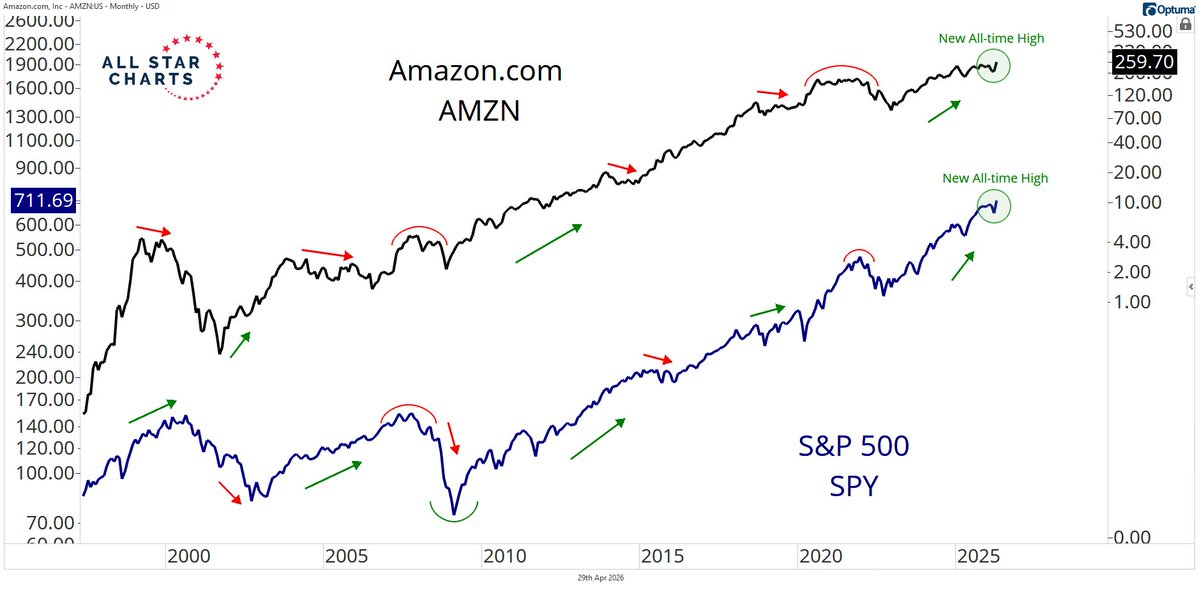
Strength in Amazon tends to coincide with strength in the broader market.
Check out the complete analysis from Alfonso De Pablos.
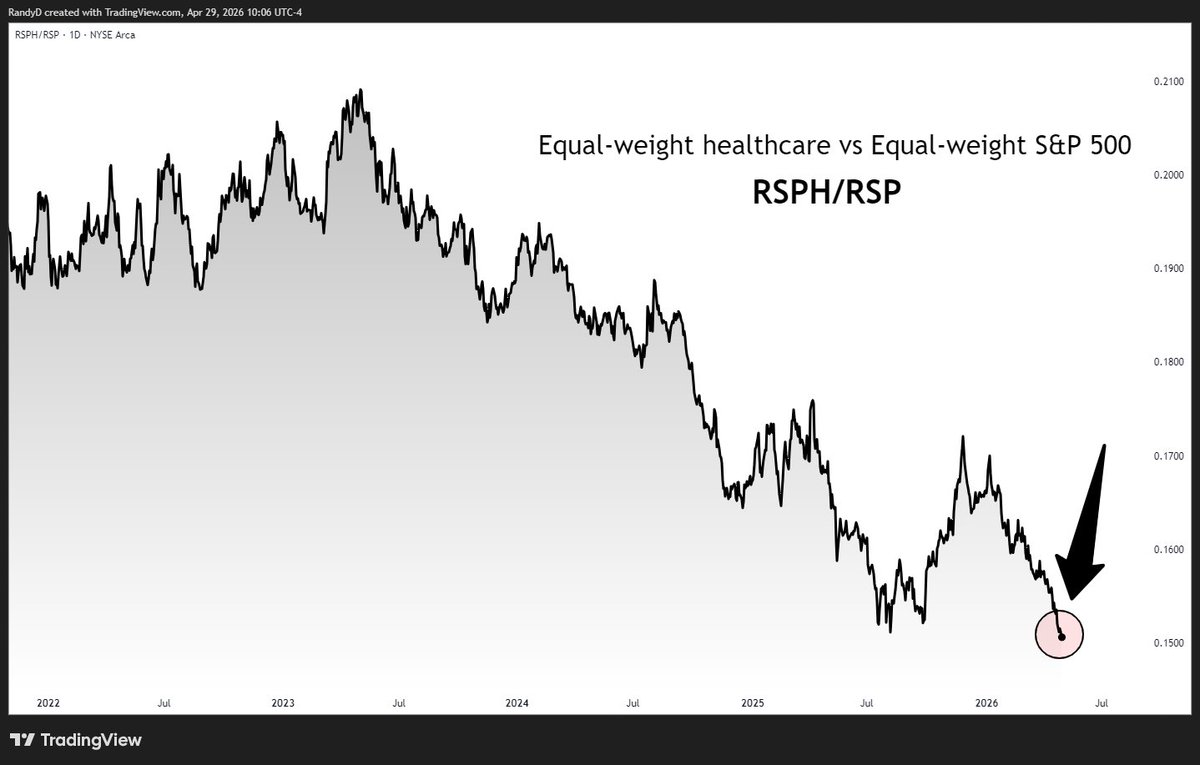
Equal Weight Healthcare is at its lowest levels since 2013 relative to the S&P 500.
View the complete post from Randy Dunham.
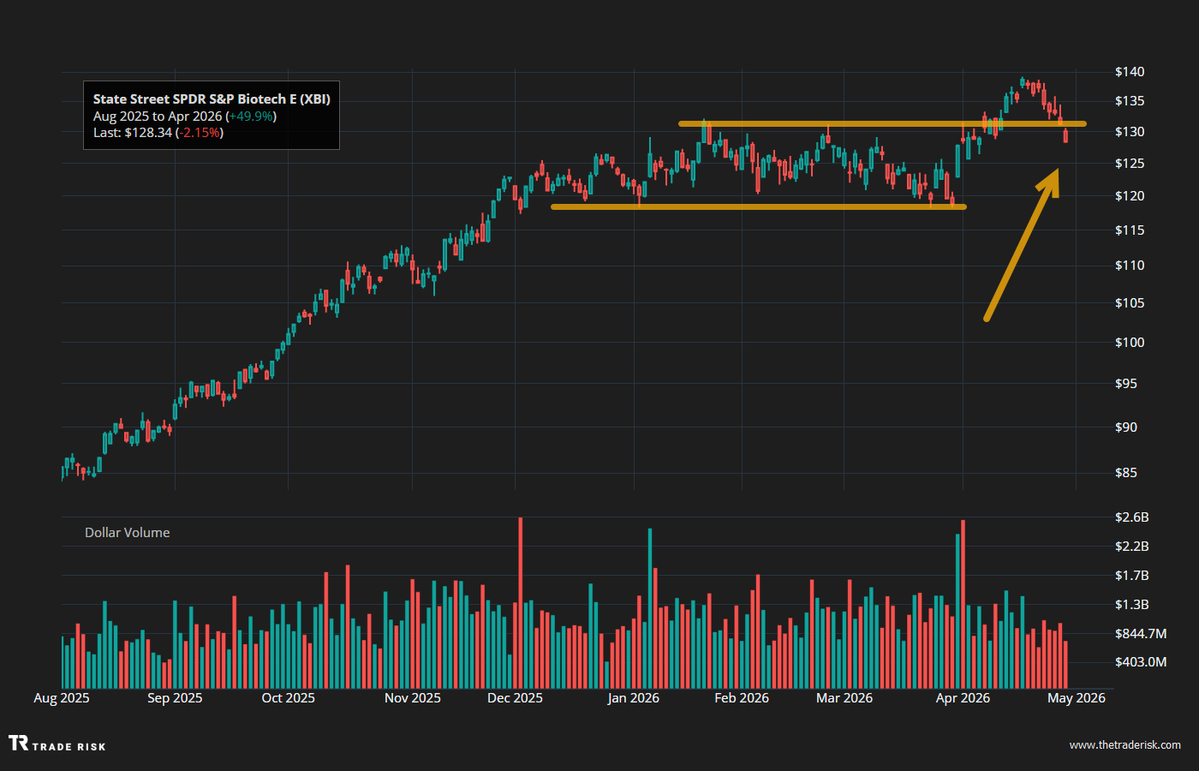
The Biotech ETF has broken back below its January highs.
See the full tweet from Evan Medeiros.
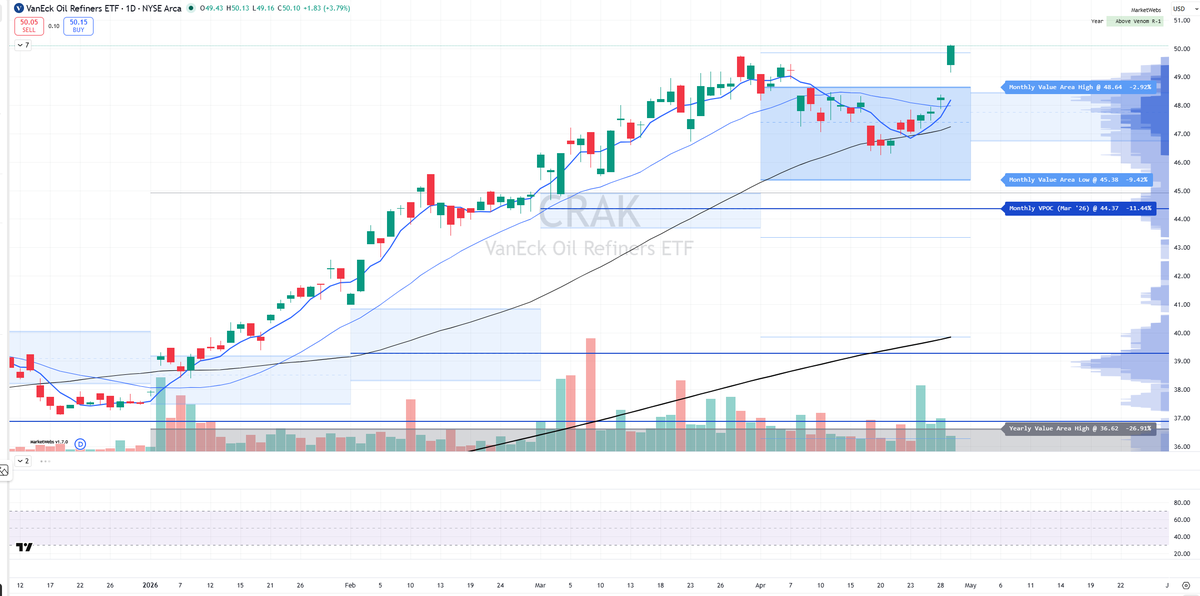
The Oil Refineries ETF had a gap & go breakout to new all-time highs.
Check out the whole post from Christian Fromhertz.
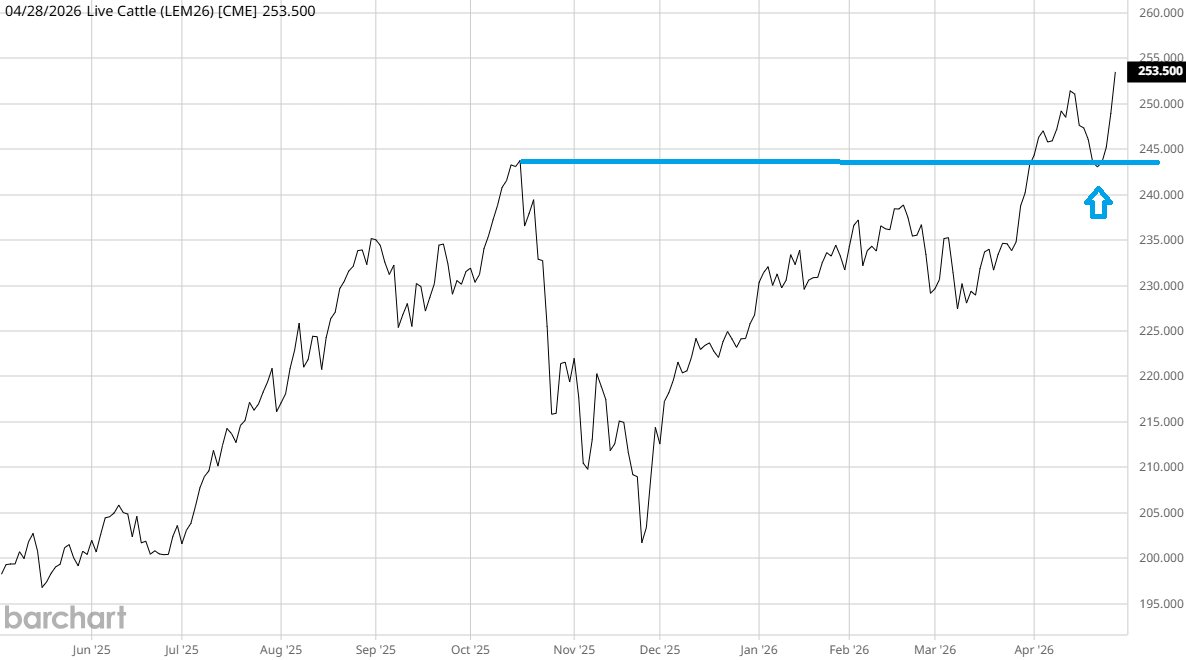
Cattle futures rebounded to record highs after holding its prior highs from October.
View the entire tweet from Stockspy.
The Chart Report curates best-in-class technical analysis from across the web.
If you’d like to share a chart or just say hello, email us at [email protected]