The Crown Still Belongs to Nvidia 👑 The Chart Report

Chart of the Day
🏆 Today's Chart of the Day was shared by Duality Research.
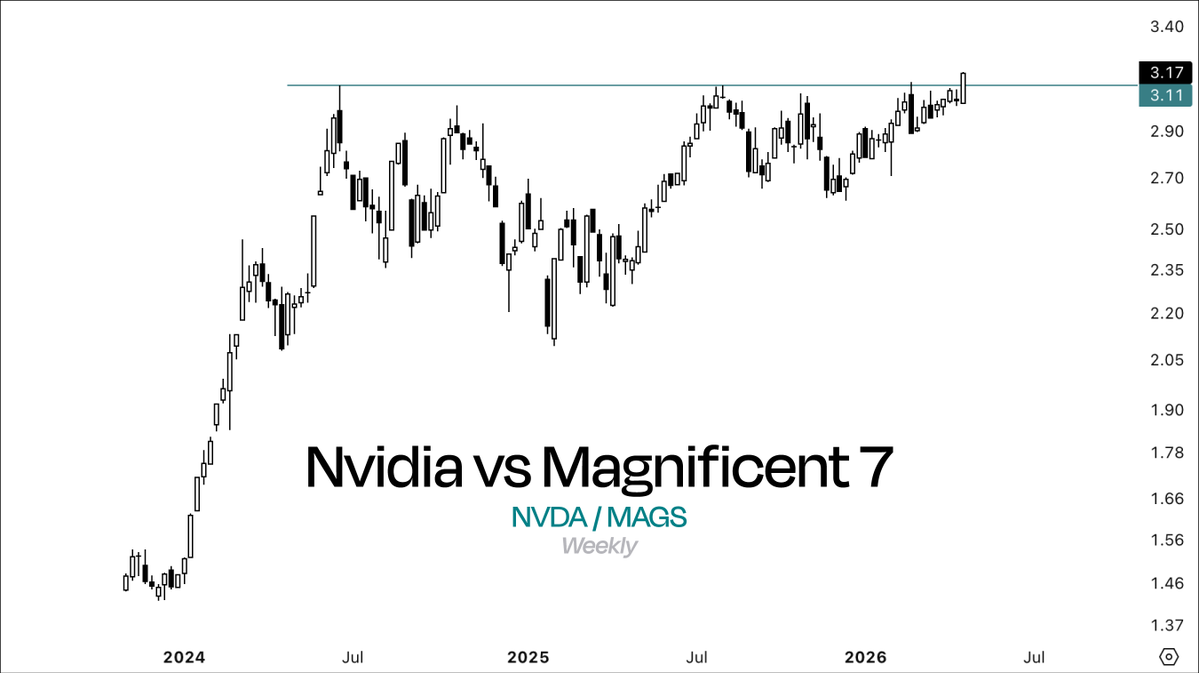
The largest company in the world just notched its highest weekly close ever and pushed to fresh all-time highs versus its mega-cap peers.
Only a month ago, the setup looked like a textbook top in the making, but Nvidia has a history of invalidating distribution patterns and is now on track for its best month in a year.
With semiconductors hitting record highs relative to the S&P 500, the message from the market is clear: semis are your industry leaders, with Nvidia firmly at the forefront.
The Takeaway: Nvidia breaking out on both an absolute and relative basis reinforces its leadership status.
More Great Charts
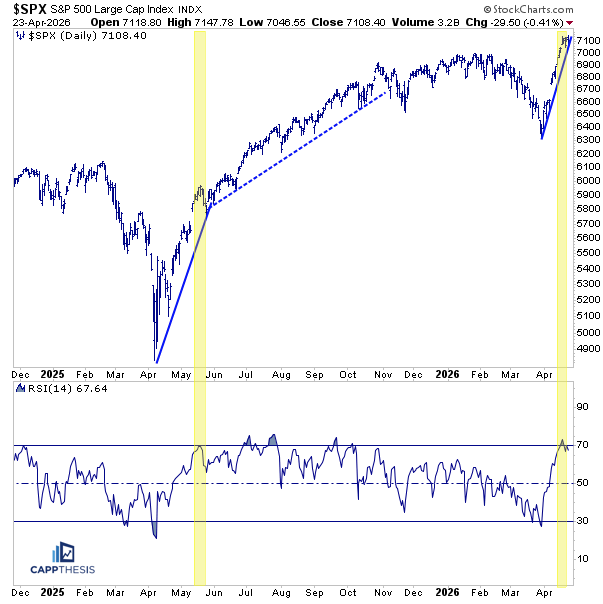
The S&P 500 has moved into overbought territory for the first time since last year.
This resembles last spring when RSI breached 70, momentum cooled, but the uptrend kept grinding higher.
Read the complete analysis from Frank Cappelleri.
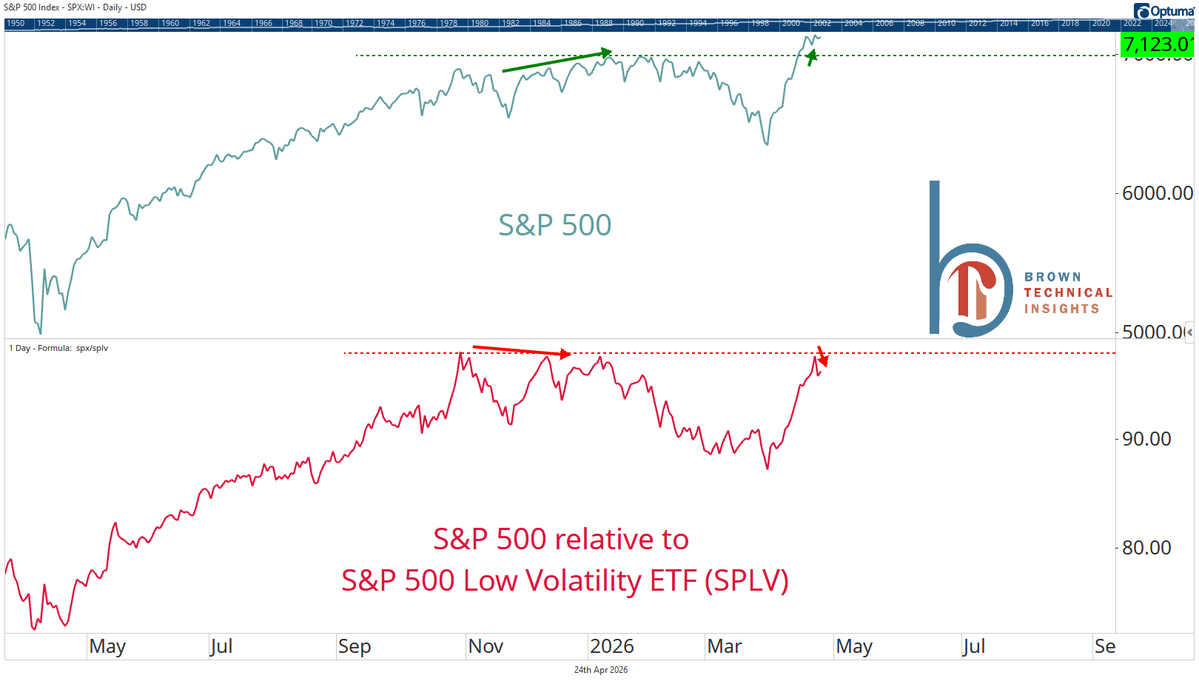
The S&P 500 relative to low volatility stocks failed to confirm last week’s new highs in the index, echoing a similar divergence seen last fall.
See the full post from Scott Brown.
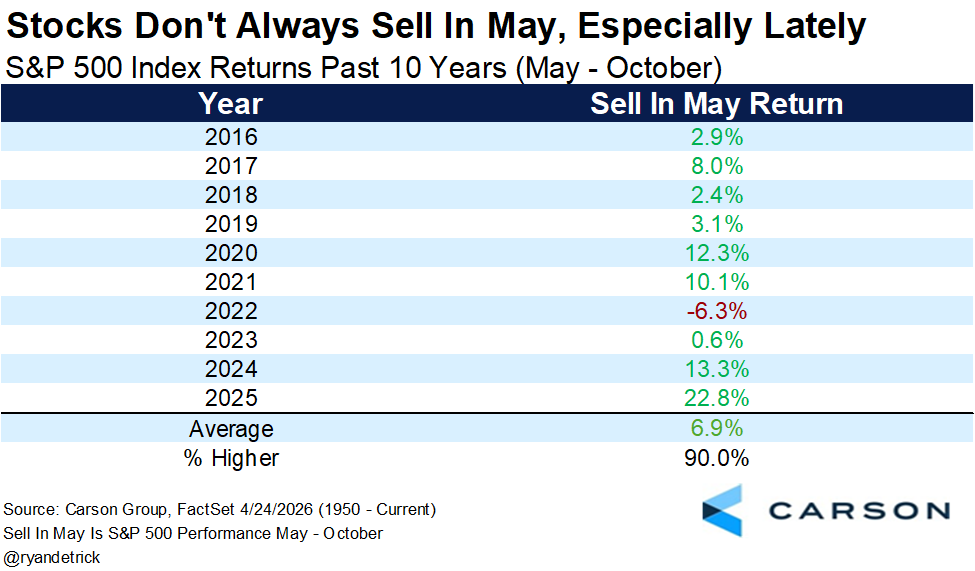
Contrary to the "sell in may and go away" notion, May-October has been positive in nearly every year over the past decade with an average gain of +7%.
View the whole tweet from Ryan Detrick.
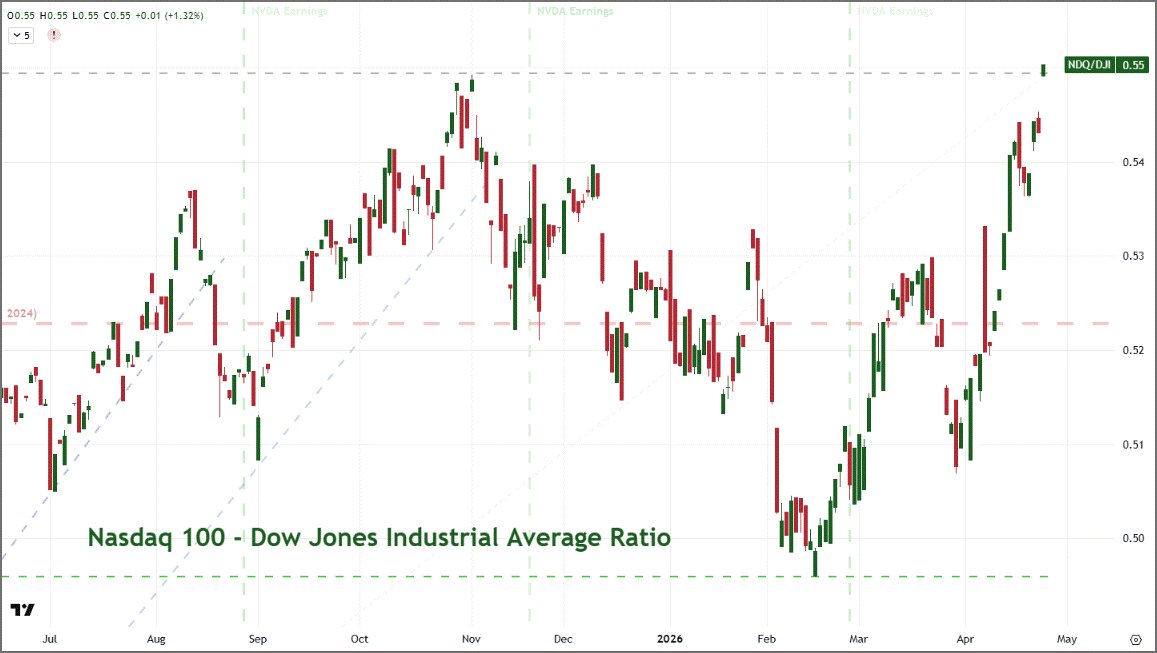
The Nasdaq 100 gapped to new all-time highs versus the Dow Jones Industrial Average.
Examine the complete post from John Kicklighter.
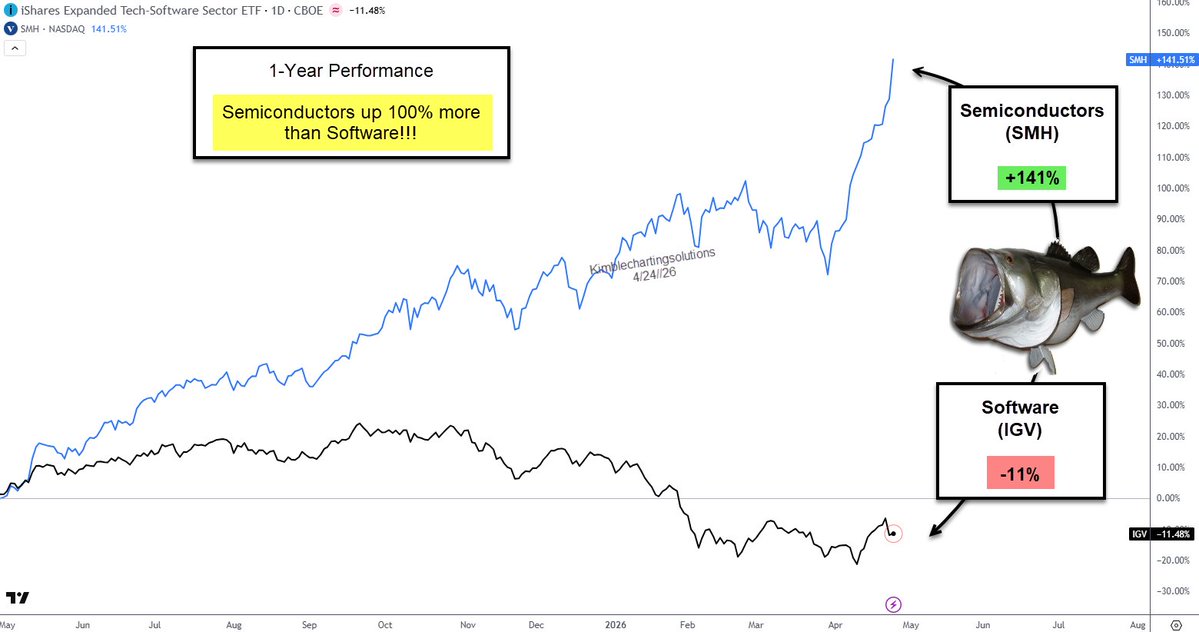
Semiconductors are up more than 100% relative to Software over the past year.
Check out the full tweet from Chris Kimble.
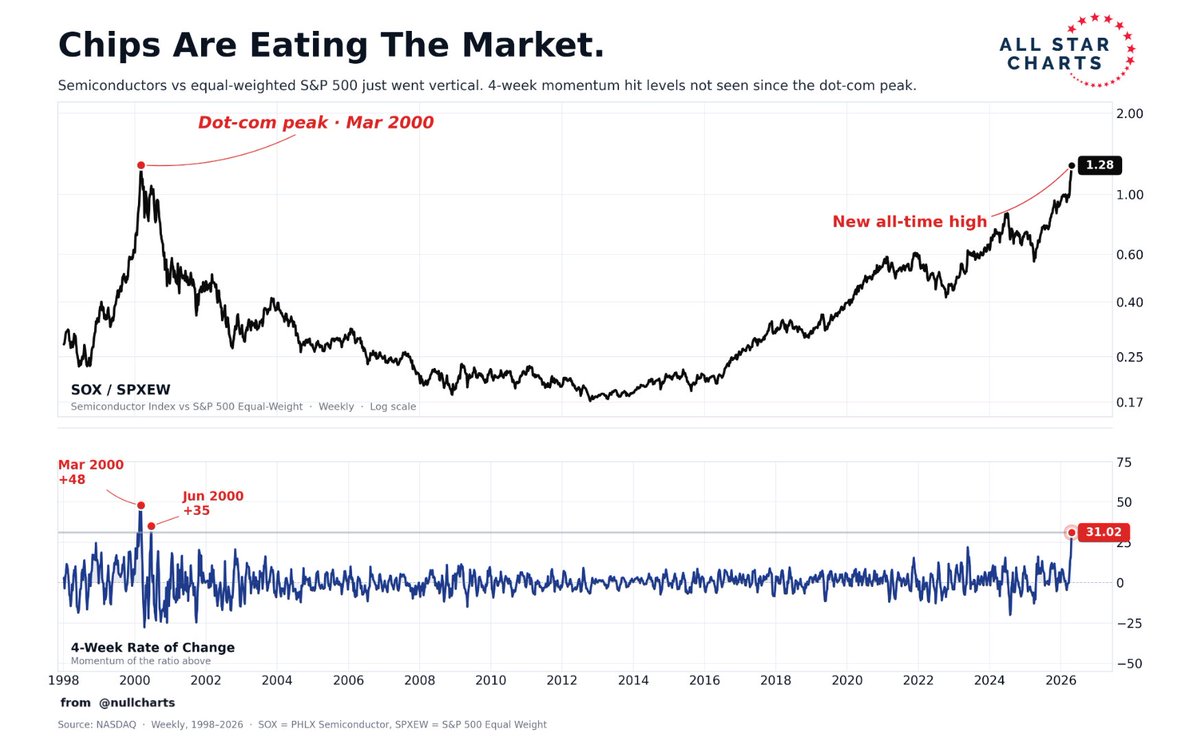
Semiconductors vs the Equal-Weight S&P just hit a new all-time high, after a +31% move in just four weeks.
This last happened in March and June of 2000.
See the entire post from Ricardo Sarraf.
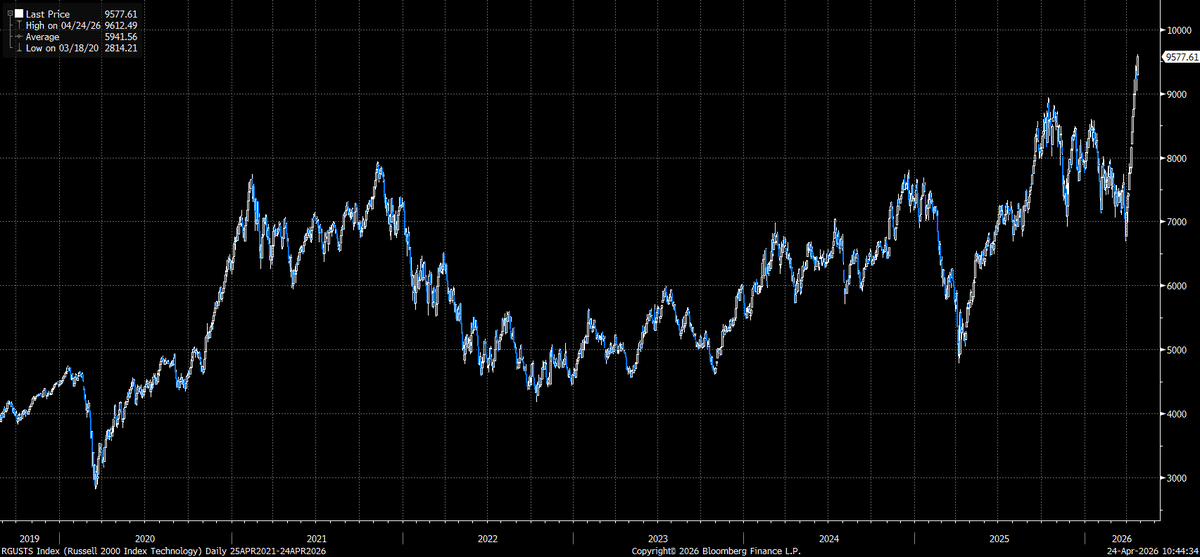
Small-Cap Technology closed at new all-time highs.
View the whole tweet from GlobalFlows.
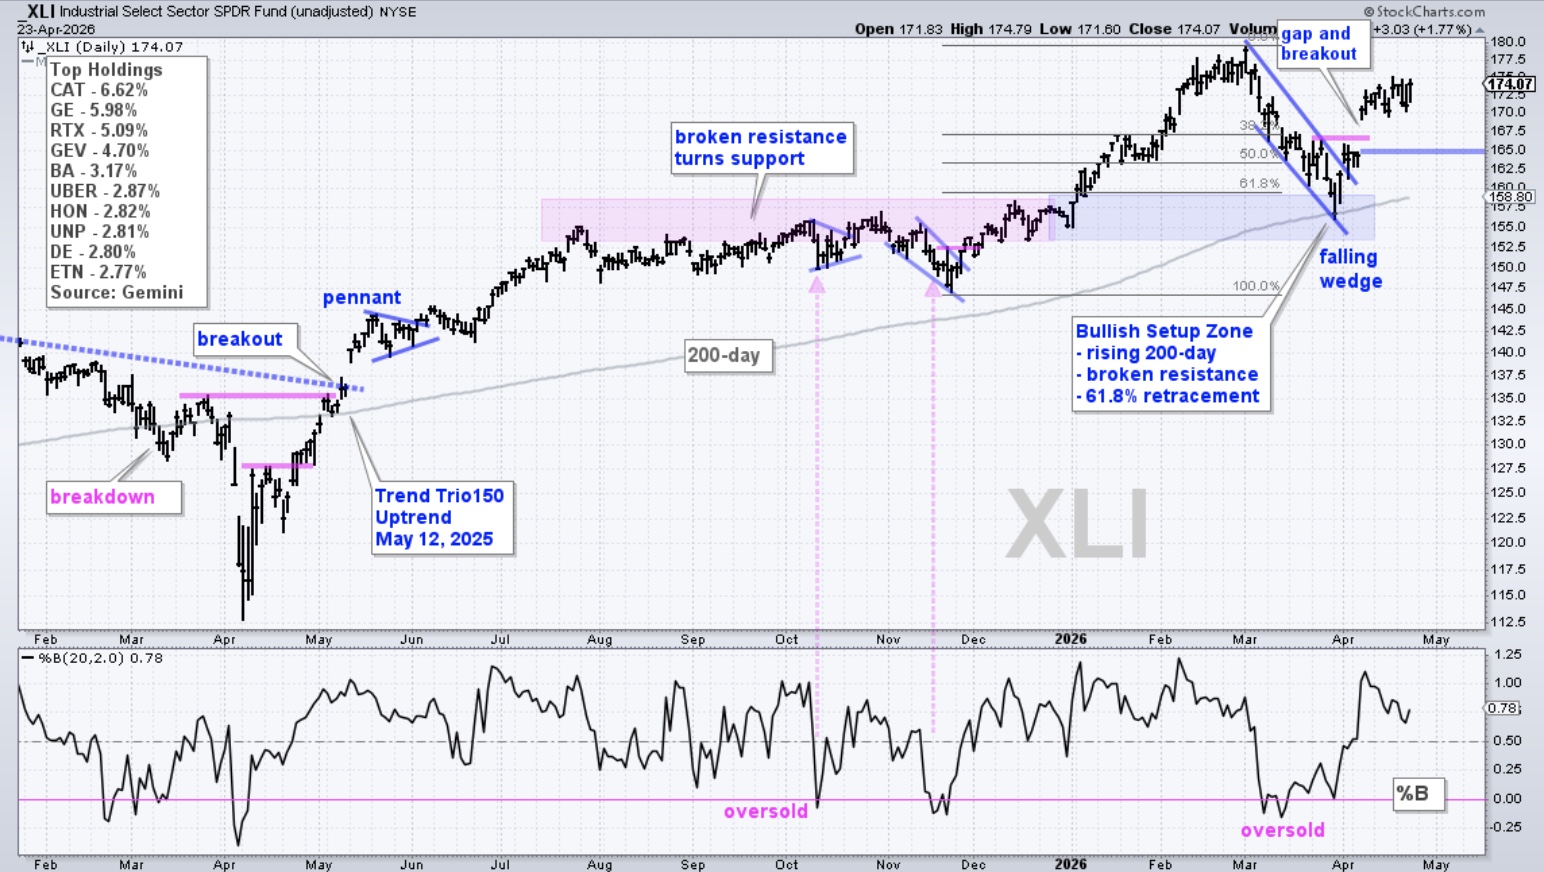
The April 8 gap-up is a key reference point for Industrials.
As long as the breakout holds, the trend remains intact; a close below 165 would invalidate the move and warrant reassessment.
Read the full analysis from Arthur Hill.
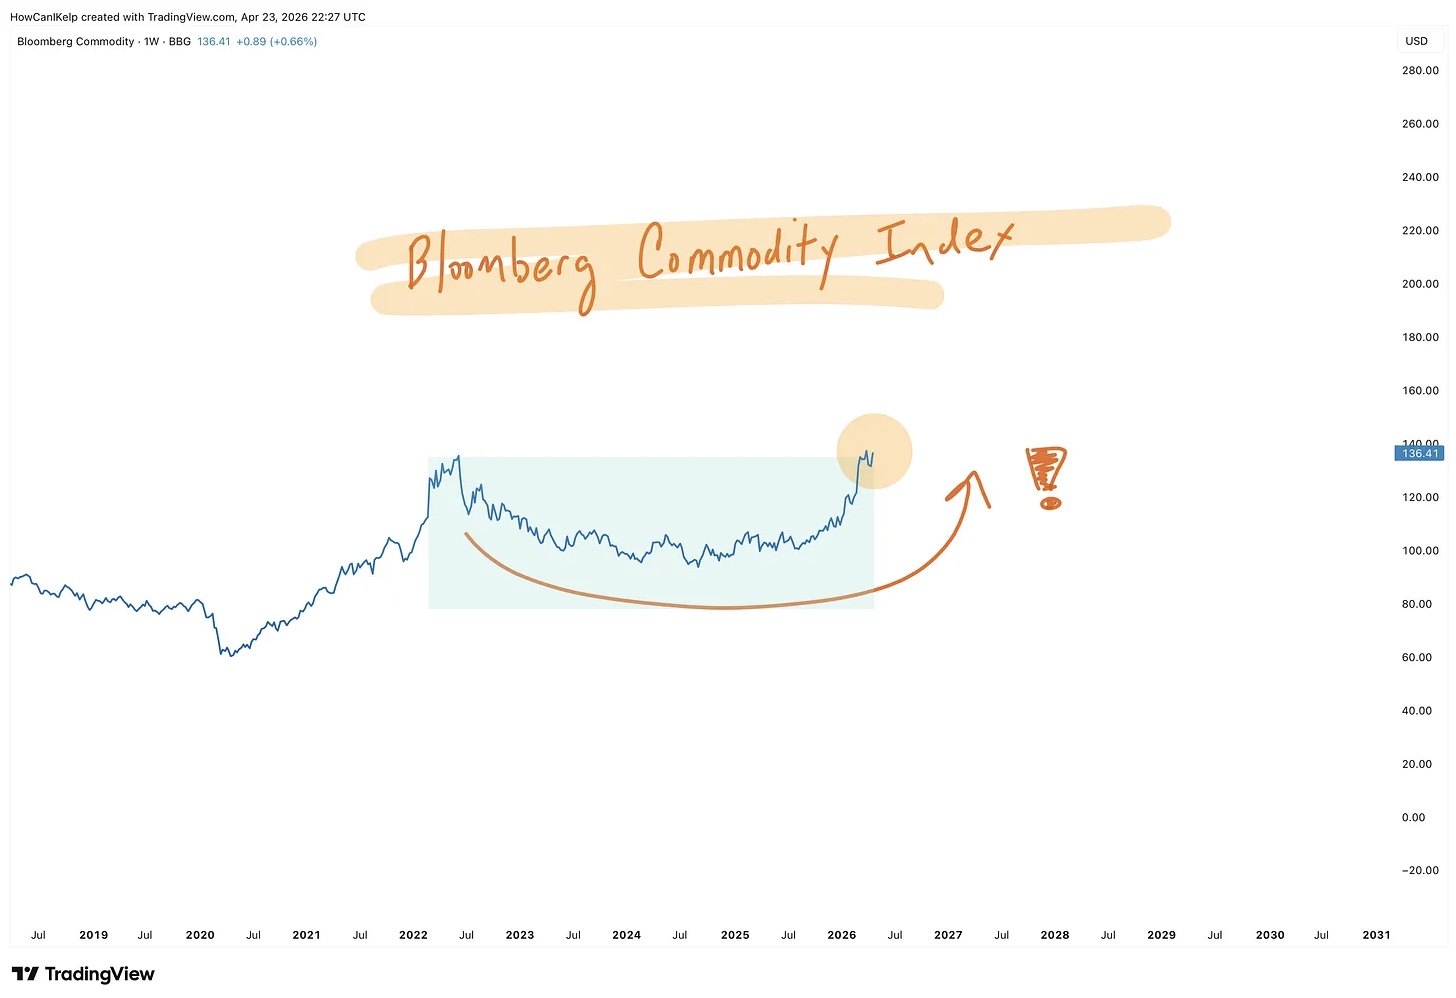
The Bloomberg Commodity Index is setting up to clear its prior cycle highs.
Read the latest article from Andy Featherston.
The Chart Report curates best-in-class technical analysis from across the web.
If you’d like to share a chart or just say hello, email us at [email protected]