Strength is Spreading Across the Tape 📈 The Chart Report

Chart of the Day
🏆 Today's Chart of the Day was shared by Market Watch via Neil Sethi.
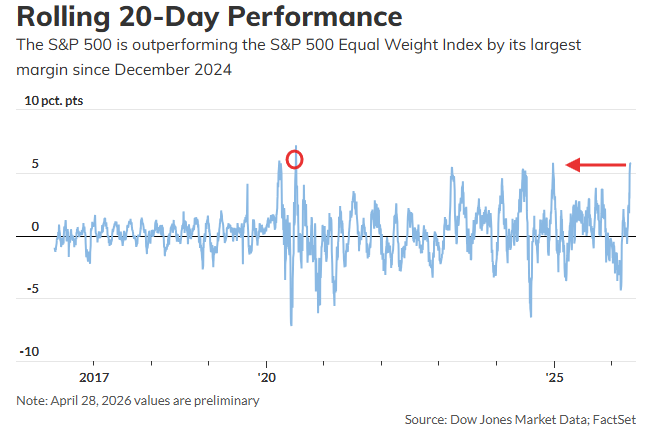
The Equal Weight S&P 500 (RSP) snapped a seven-day losing streak, and logged its fifth-best daily gain of the year.
Coming into today, the cap-weighted S&P 500 had outpaced the equal weight by the widest margin since December 2024, underscoring the outsized leadership from mega-cap names off the recent lows.
While RSP still hasn’t reclaimed its February highs, improving momentum across the broader market paints a constructive backdrop for a potential next leg higher.
The Takeaway: Today's action in the equal weight S&P suggests underlying strength is expanding beyond the market's largest stocks.
More Great Charts
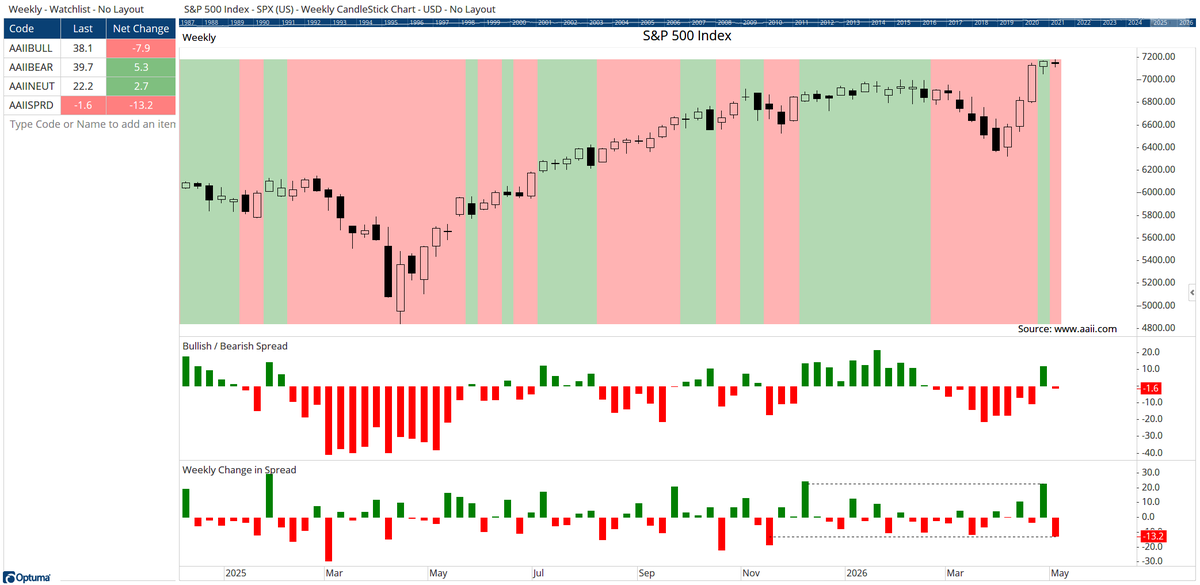
The AAII Bull/Bear spread has quickly swung back into negative territory after just one week, marking the sharpest weekly deterioration in sentiment since mid-November.
View the full post from Optuma.
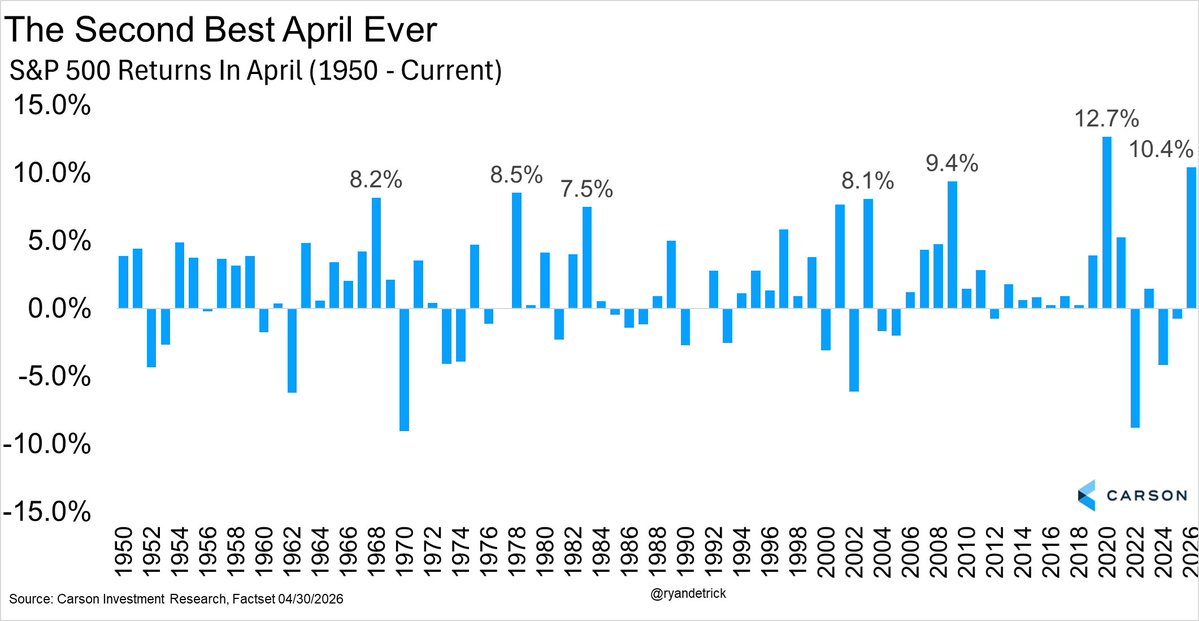
We just saw the second best April in history for the S&P 500.
See the entire tweet from Ryan Detrick.
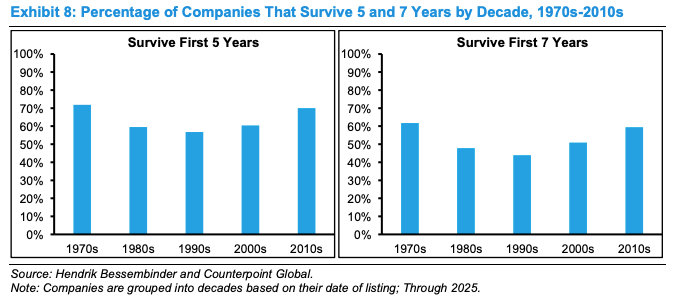
The lifespan of public companies is now at its longest level since the 1970s.
Read the full article from The Idea Farm.
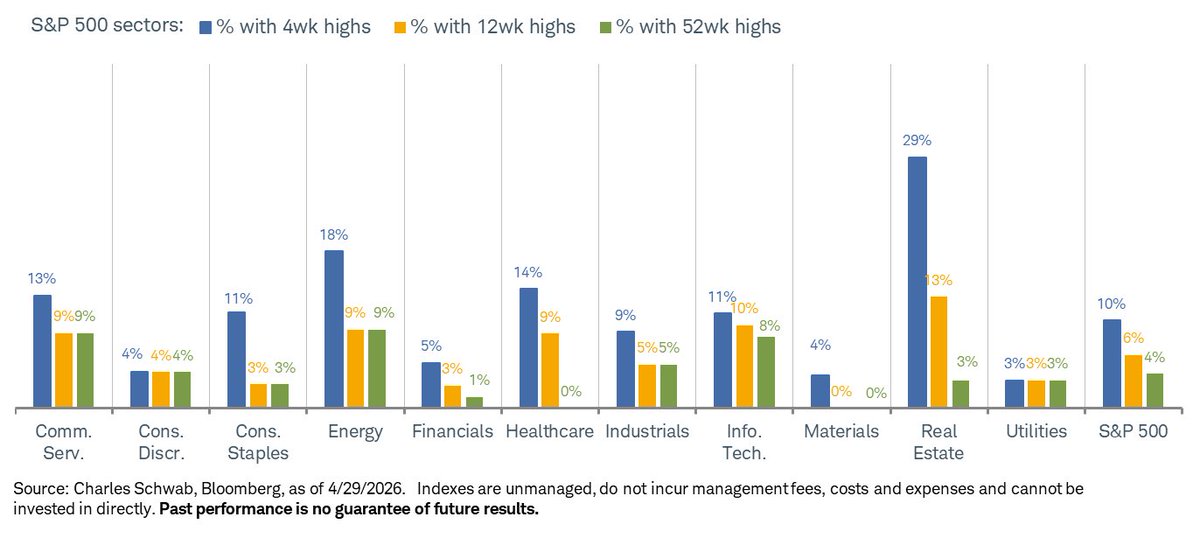
The Real Estate sector is seeing the highest percentage of stocks hitting new 1- and 3-month highs.
Check out the whole tweet from Liz Sonders.
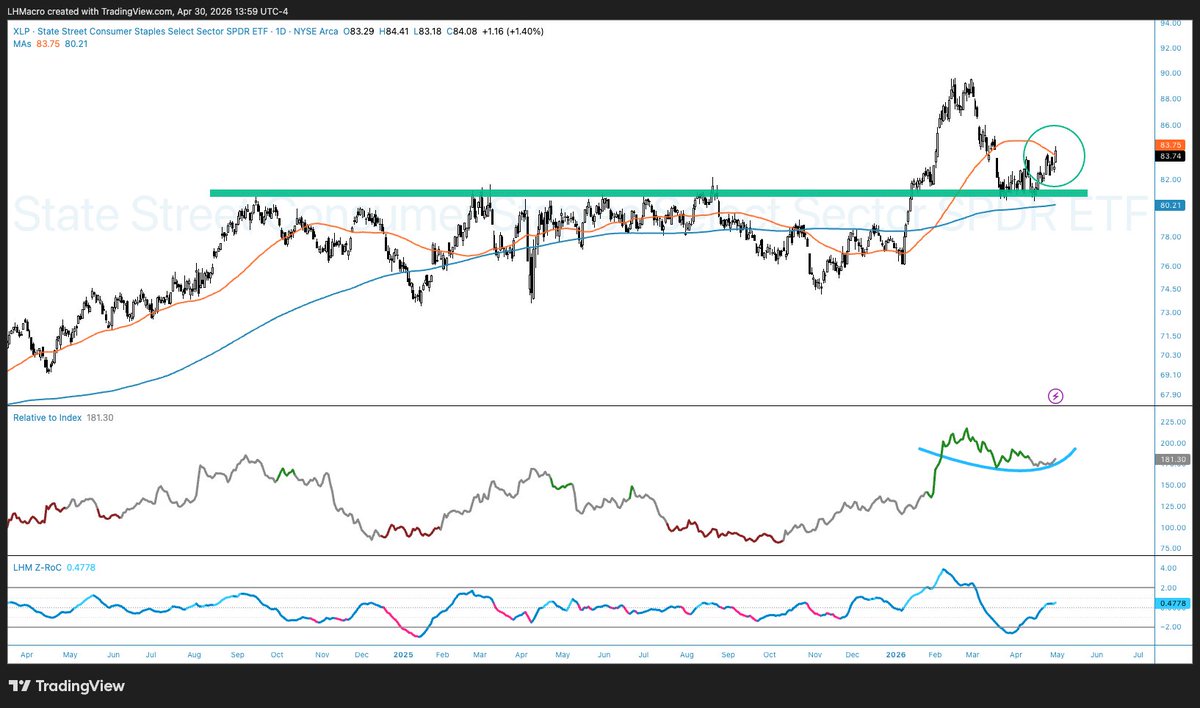
Consumer Staples are pushing back above their 50-day moving average and curling higher relative to the S&P 500.
View the entire post from Bob Sheehan.
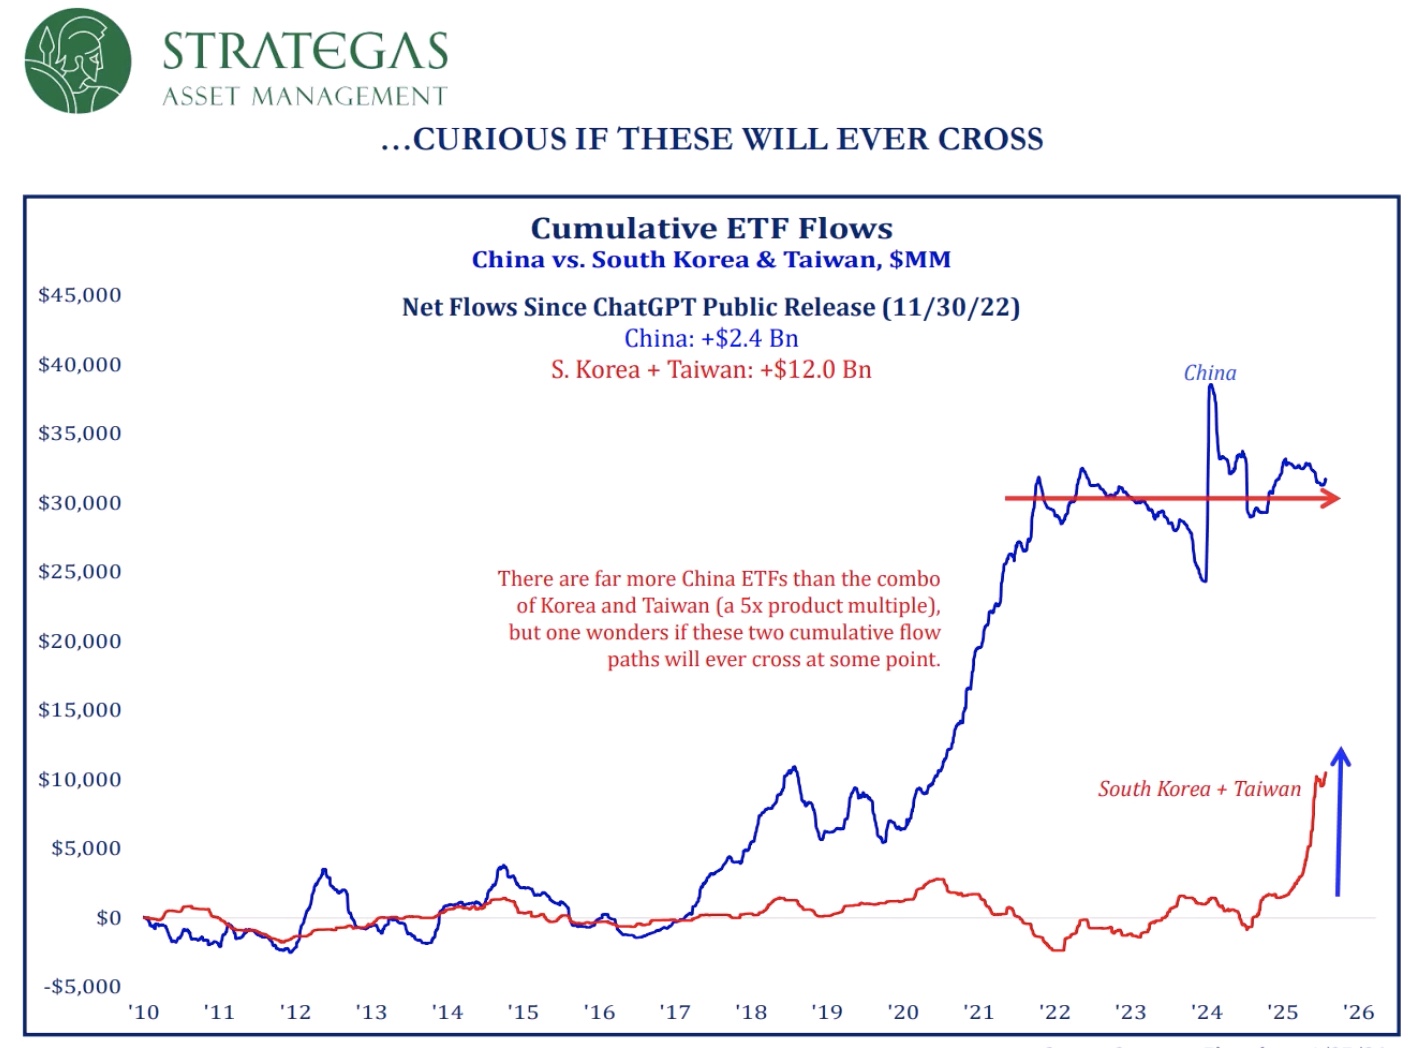
Flows into Taiwan and South Korea have accelerated alongside the semiconductor rally, while China has seen relatively muted activity.
Watch the full analysis from Todd Sohn.
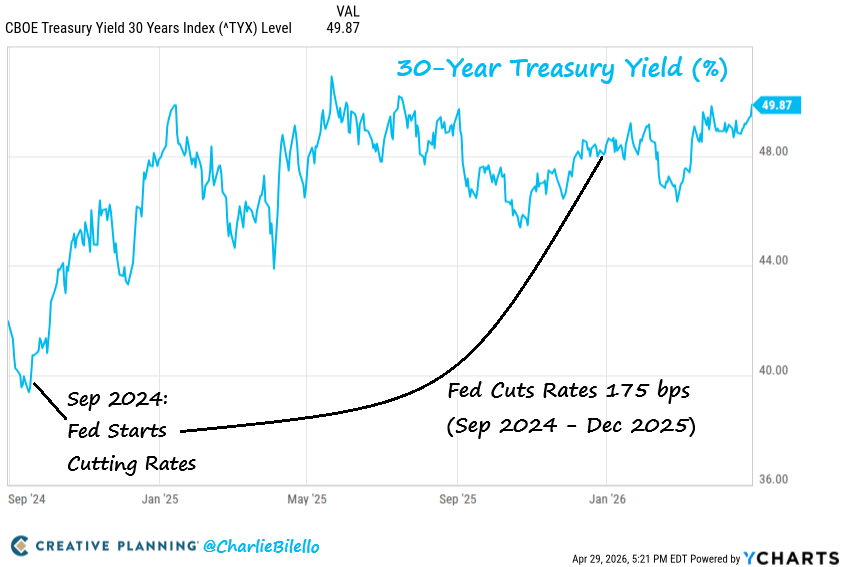
Despite the Fed cutting rates by 175 basis points since September 2024, the 30-year Treasury yield has climbed from below 4% to near 5%.
Read the latest article from Charlie Bilello.
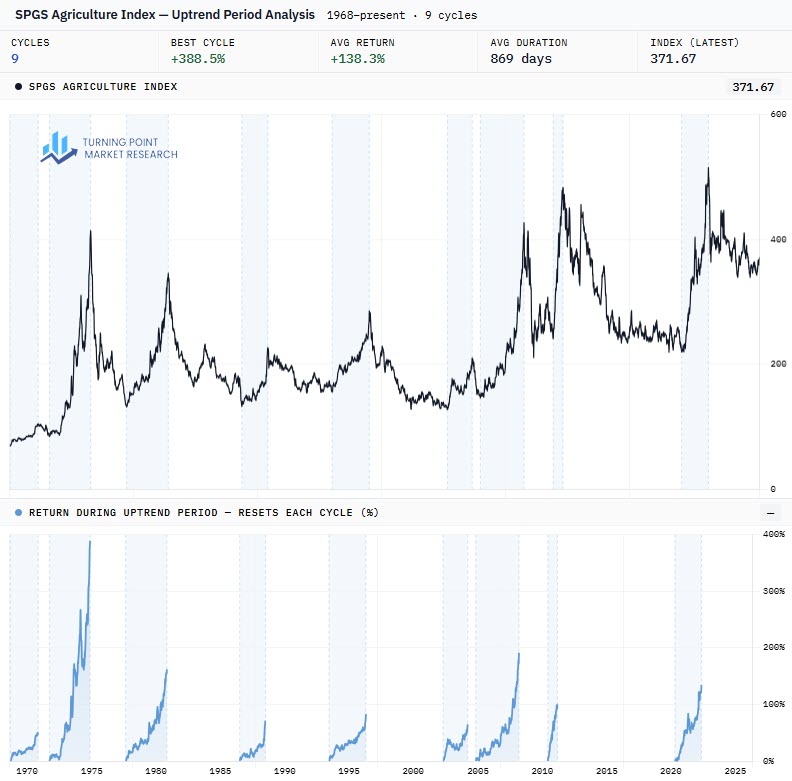
Agricultural commodities appear to be setting up for what would be their tenth cyclical upswing since the 1960s.
See the complete post from Turning Point Market Research.
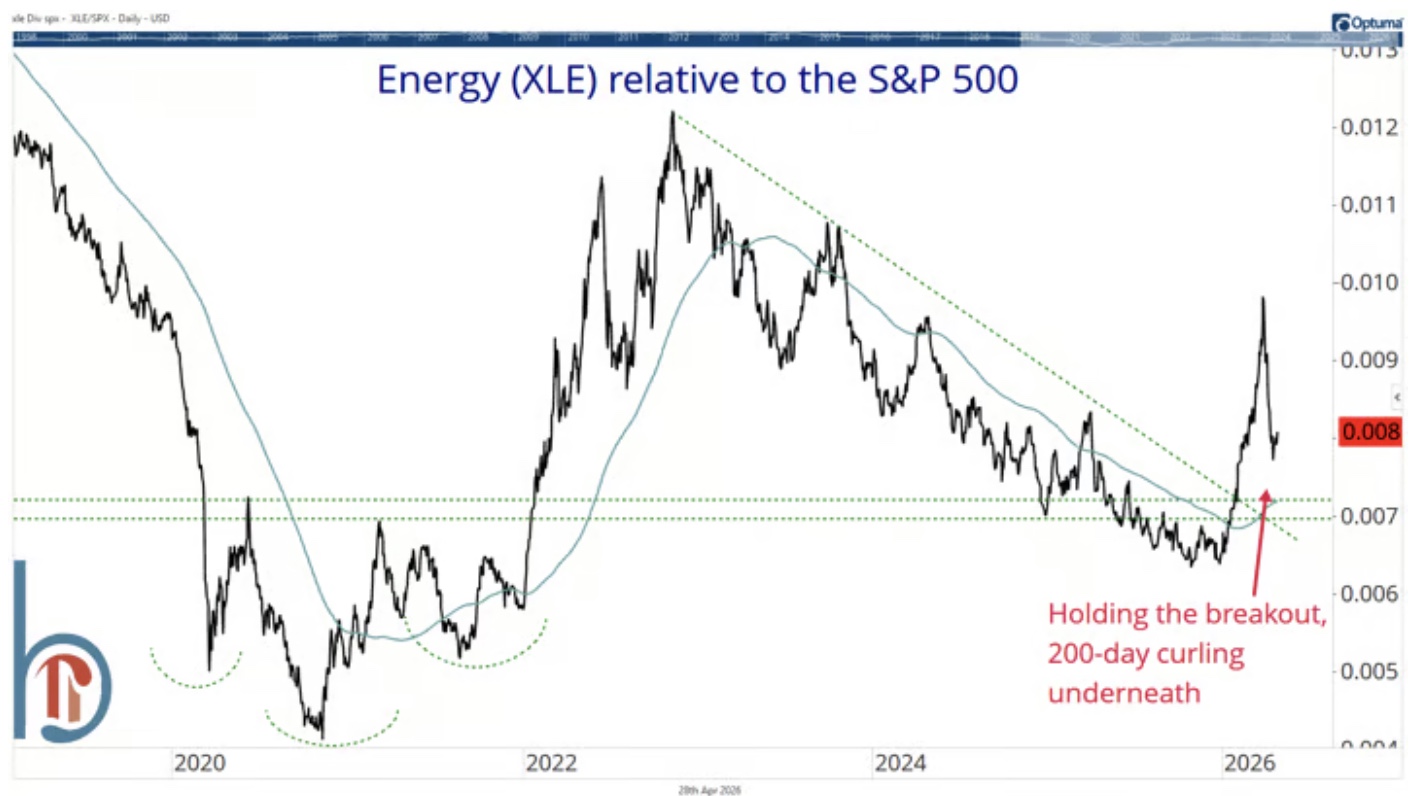
Energy relative to the S&P 500 continues to hold its breakout and remains above an upward-sloping 200-day moving average.
Read the full analysis from Scott Brown.
The Chart Report curates best-in-class technical analysis from across the web.
If you’d like to share a chart or just say hello, email us at [email protected]