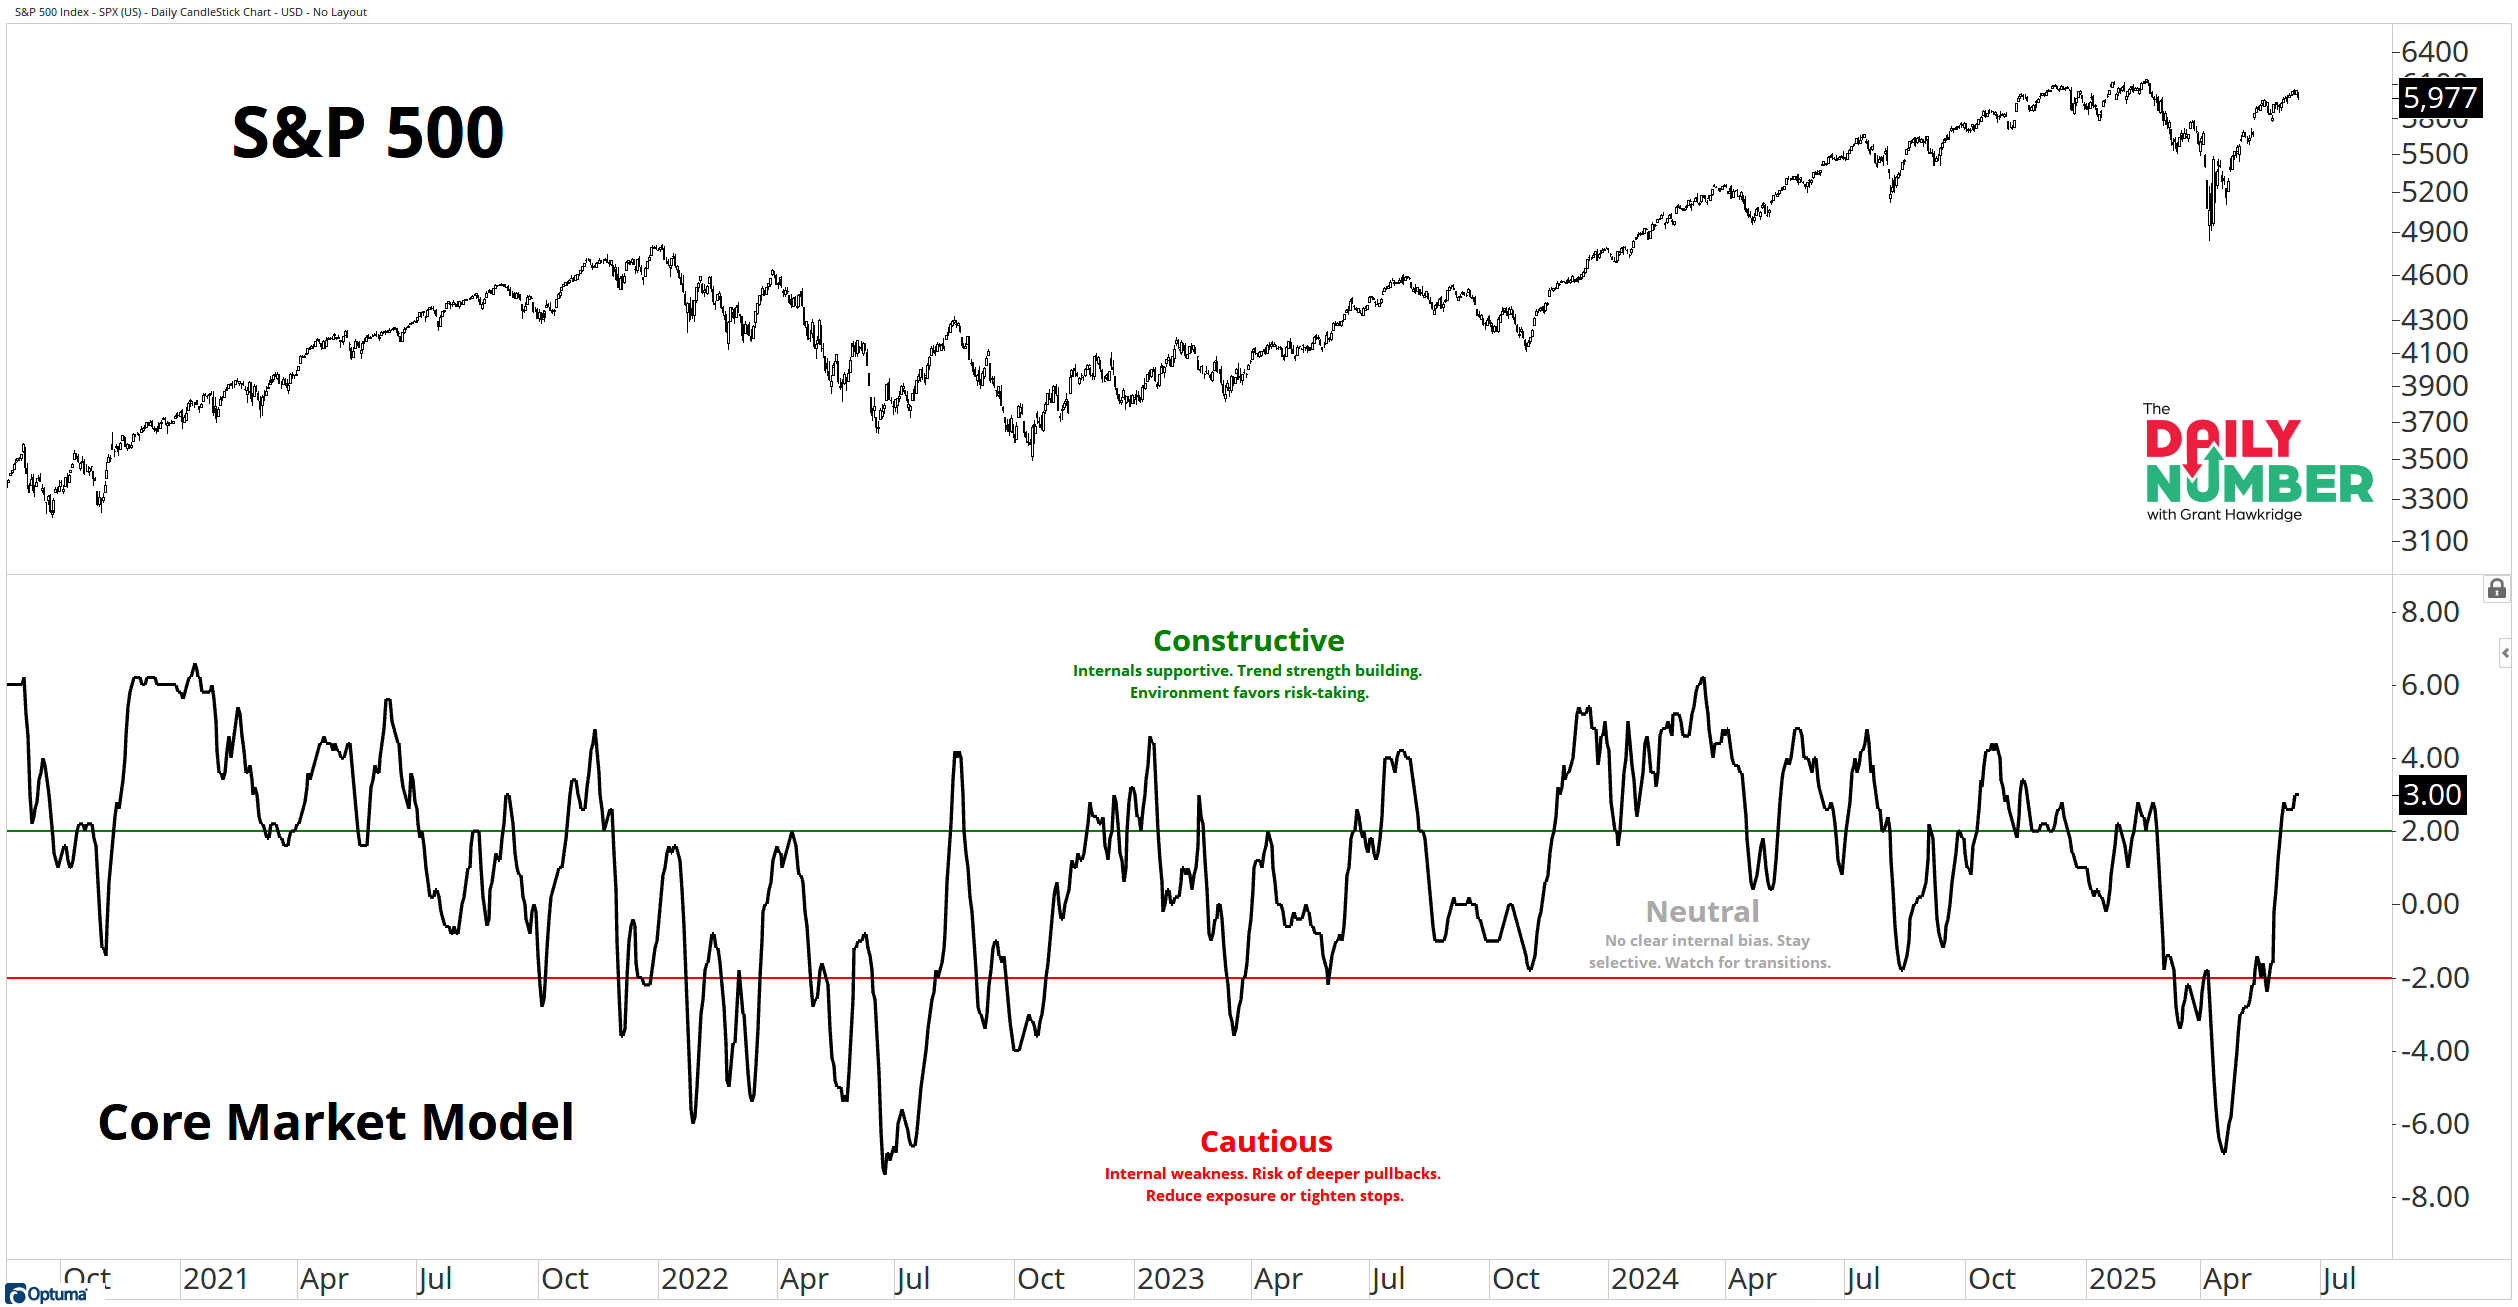
My Core Market Model has climbed to 3 — its highest reading since November 2024.
Here’s the chart:
Let's break down what the chart shows:
The candlesticks in the top panel is the S&P 500 index price.
The black line in the bottom panel shows the Core Market Model — a composite of breadth, liquidity, and sentiment.
The Takeaway: At 3, the Core Market Model is sending a clear message: internals are strong and strengthening.
When these inputs align, trend conditions tend to improve — and that’s what we’re seeing now.
Two weeks ago, the model flipped positive. Since then, it’s gained momentum — moving firmly into what I call the Constructive zone.
That’s where markets tend to behave better: pullbacks get shallower, trends persist, and volatility fades.
This isn’t guesswork. Over two decades of data, the Constructive zone has delivered the most reliable forward returns — with tighter drawdowns and less noise.
We’re not stretched. We’re supported. That’s what matters.
This isn’t about guaranteed upside — it’s about better conditions to take risk.
It’s not about calling the next move — it’s about trading in the right environment.
The Core Market Model isn’t a signal. It’s a lens.
And right now, it’s saying: the wind’s at our back.
Grant Hawkridge | Chief Aussie Operator, All Star Charts
From breakout setups to sector rotation, we cover what matters. With Premium, you get curated watchlists like the “Hall of Famers” and “Freshly Squeezed” — plus our take on what to do with them. Stay on top of the action and trade with confidence.
If you find my content valuable, I would greatly appreciate it if you could share it with your friends, family, and colleagues. Your help in spreading the word is invaluable in supporting our work. Thank you to all of you who share!