The Indices Aren't Telling the Whole Story 📈 The Chart Report

Chart of the Day
🏆 Today's Chart of the Day was shared by Christian Fromhertz.
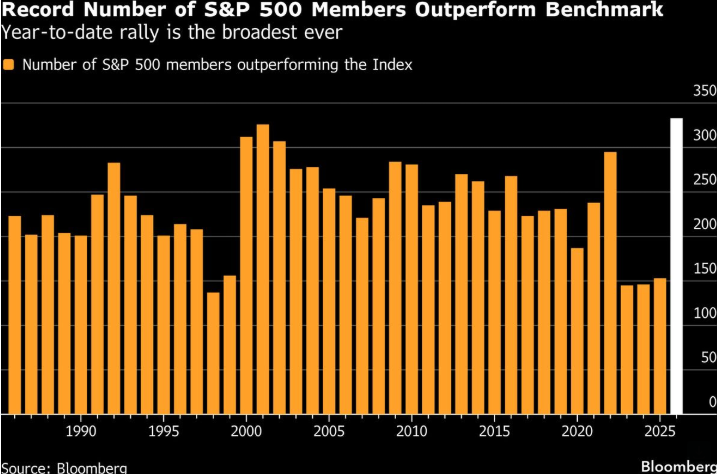
Dispersion has been the word of the year so far.
While the S&P 500 sits roughly flat on the year, more than 300 of its components are outperforming the index, marking the broadest rally on record.
Participation has expanded meaningfully, and leadership is no longer confined to the mega-caps.
The Takeaway: The market is being supported by historically strong breadth.
More Great Charts
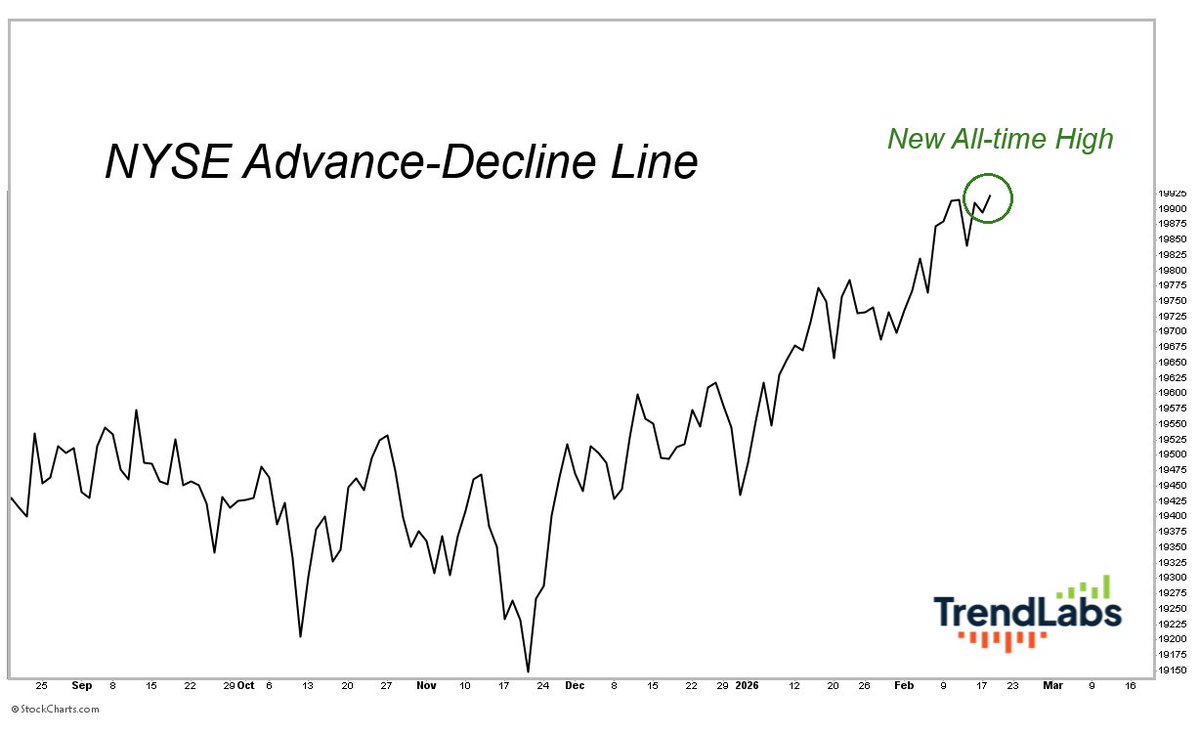
More stocks are advancing than declining.
This is normal bull market behavior.
Check out JC Parets' full post.
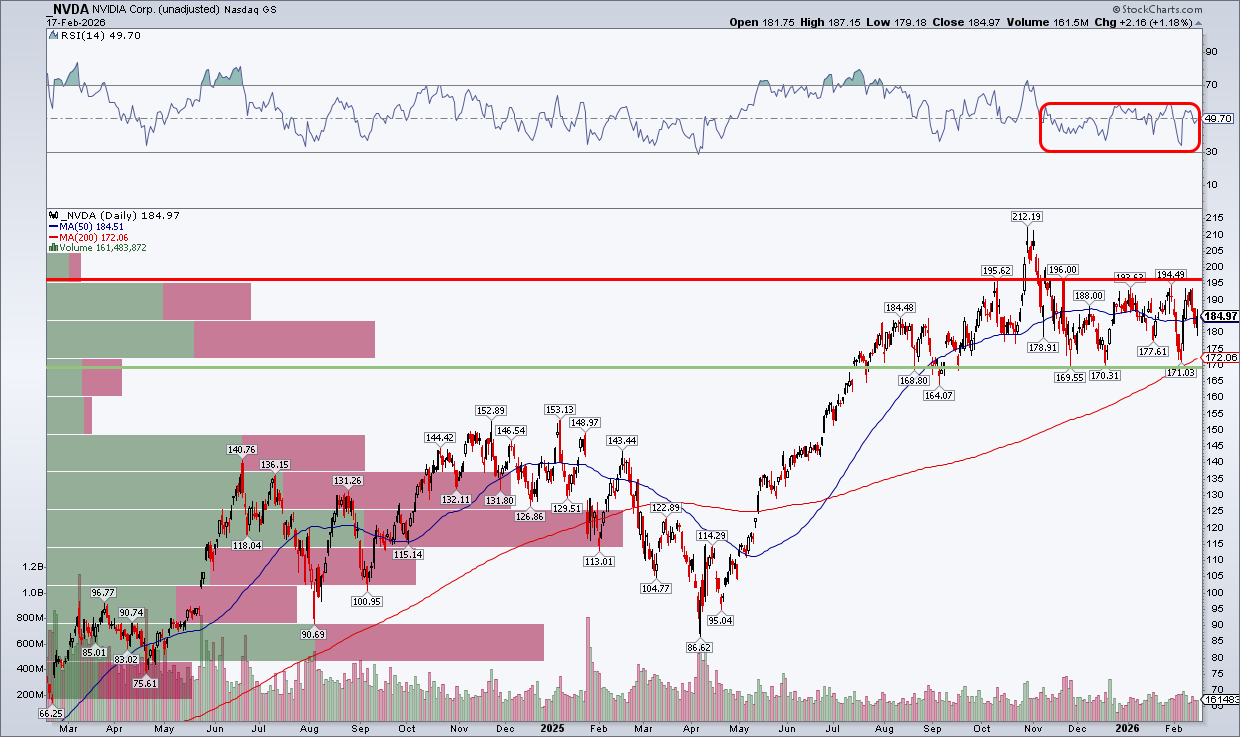
The world’s most valuable company remains rangebound between $170 and $195, with RSI continuing to weaken.
Mike Zaccardi breaks it down in his latest market note.
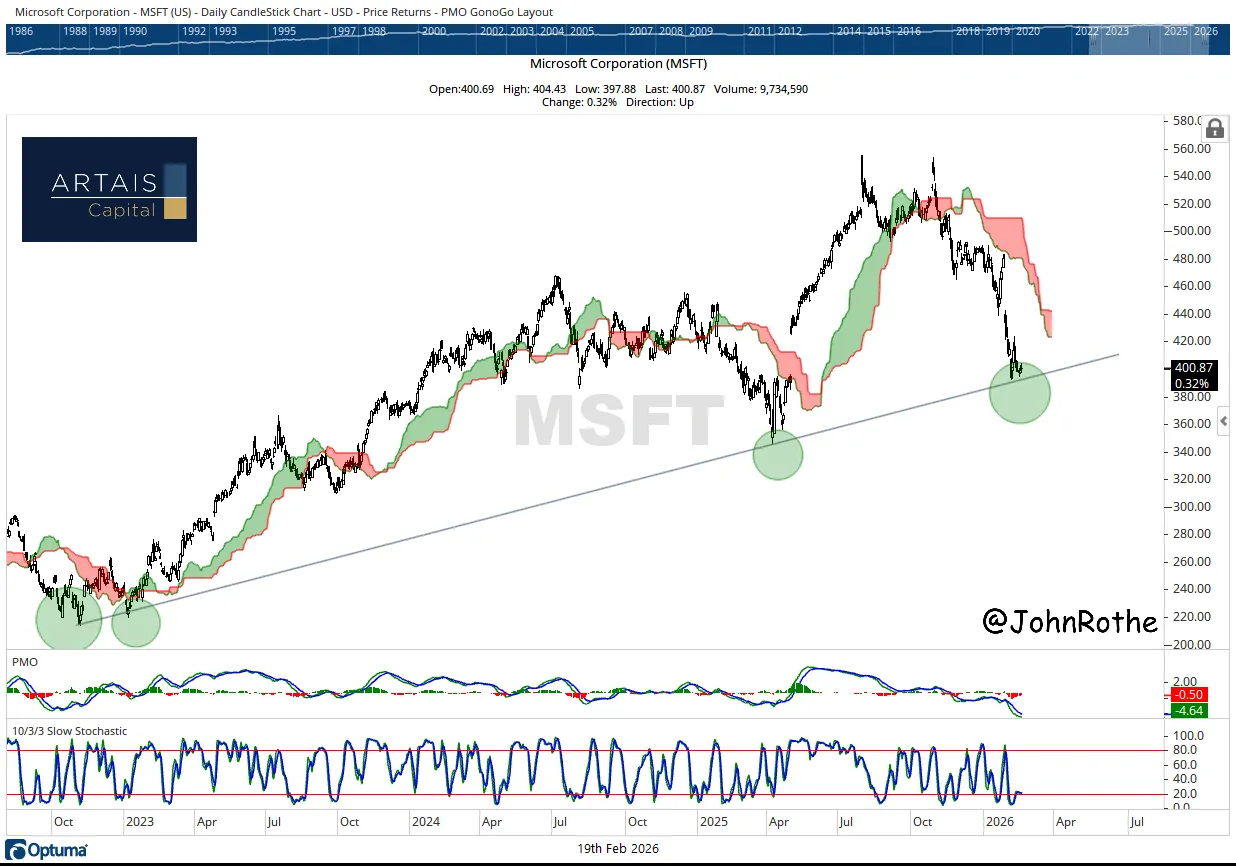
Microsoft has retraced all the way back to its trend-line from the bear market lows.
John Rothe assesses whether this move signals exhaustion.
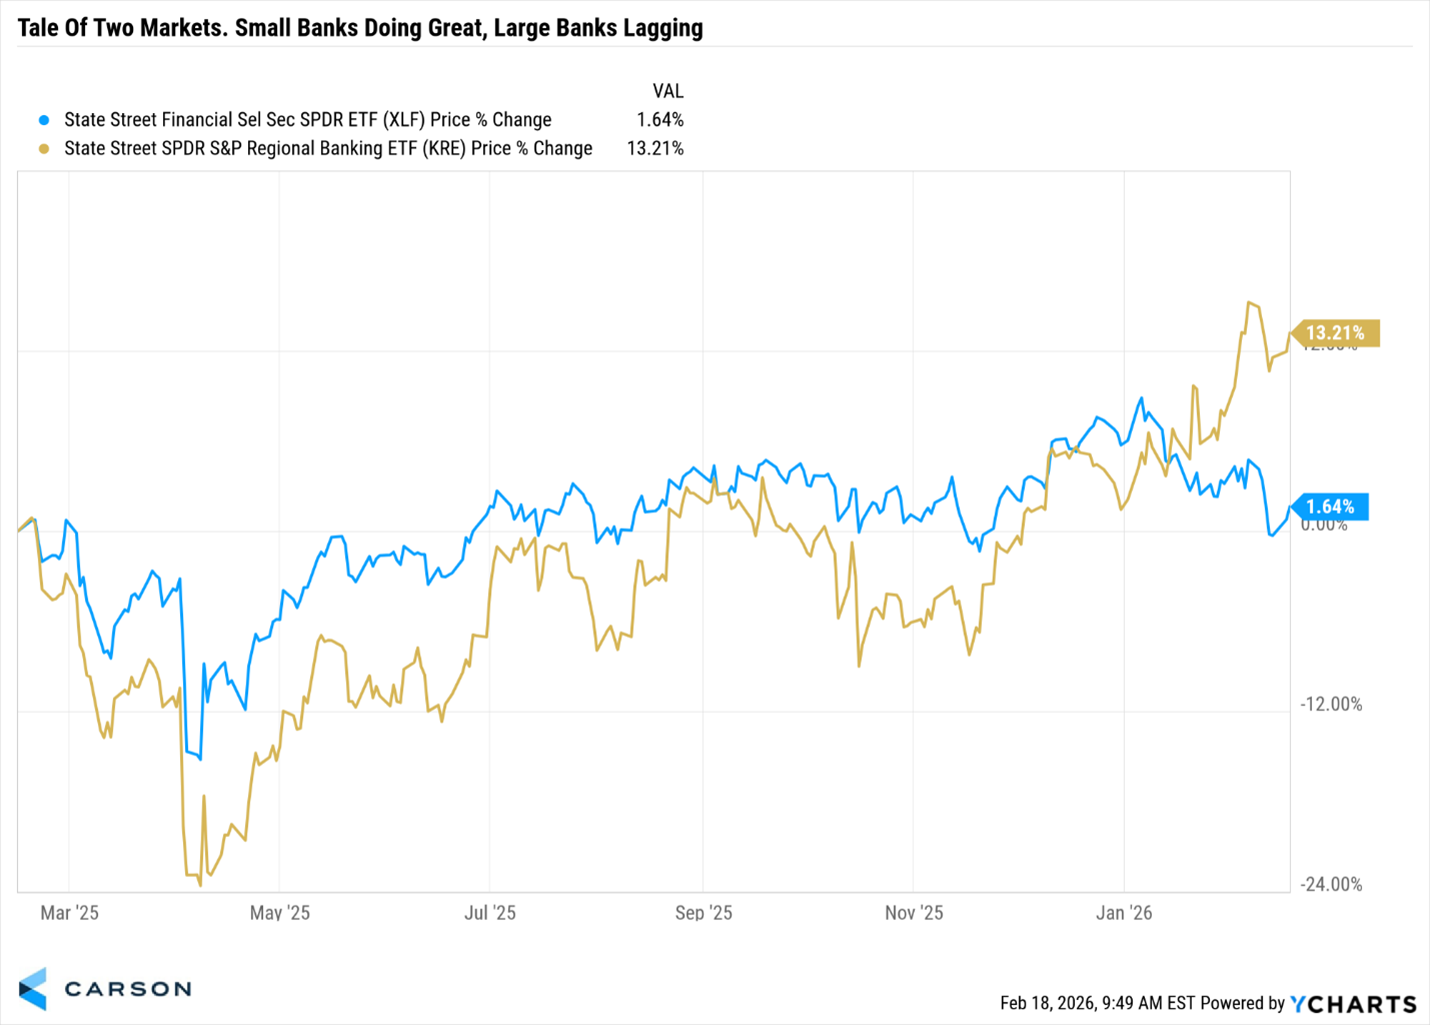
Regional banks are gaining ground even as the major banks remain under pressure.
Explore Ryan Detrick's detailed analysis.
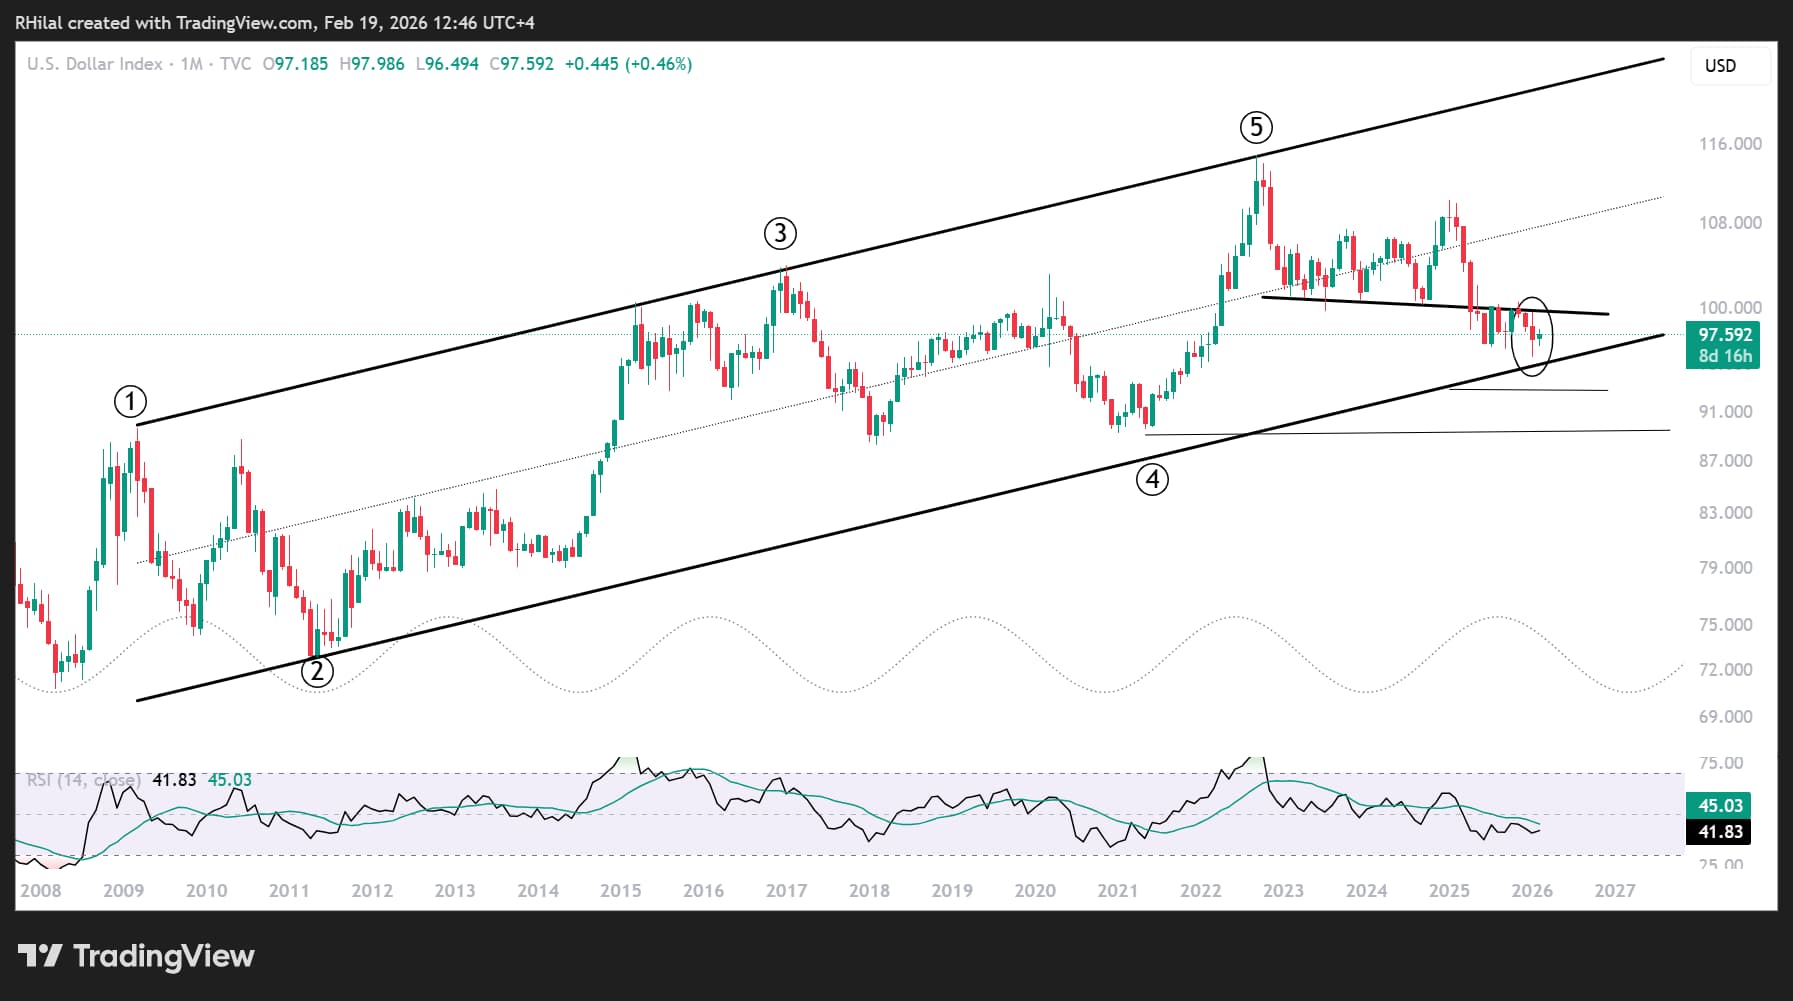
The 18-year channel in the U.S. Dollar Index remains intact, but a break below 95 would suggest a structural shift lower.
Read Razan Hilal’s fresh take.
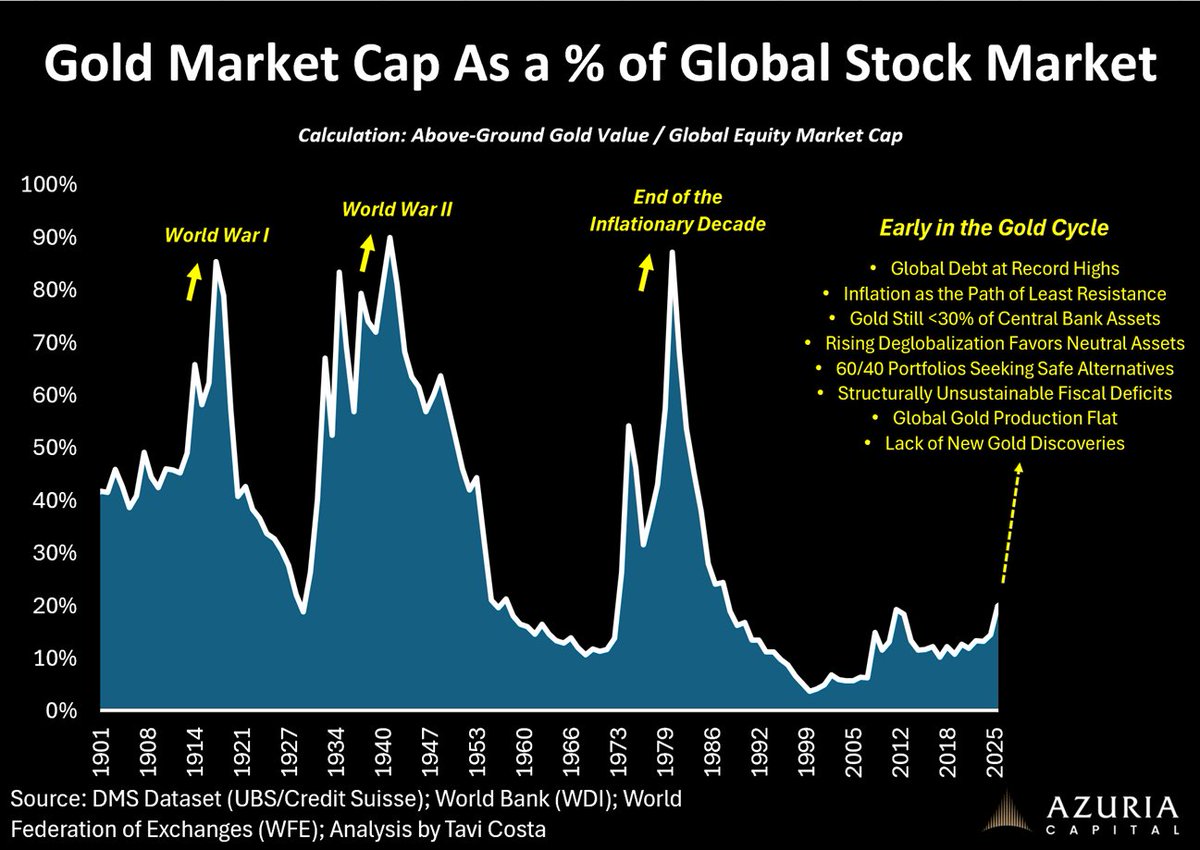
The relative size of the gold market versus global equities highlights the early stage of this reallocation.
Otavio Costa provides the context.
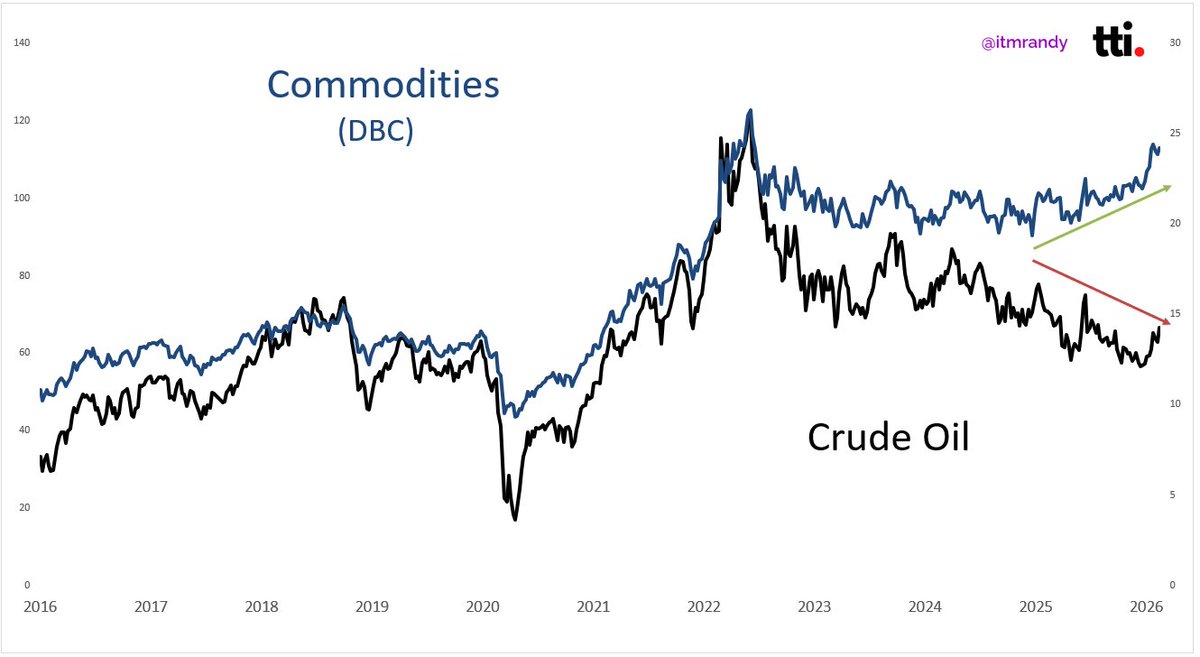
Crude oil just posted its strongest two-day gain since last October and may be poised to play catch-up with the broader commodity complex.
View Randy Dunham's complete tweet.
The Chart Report curates best-in-class technical analysis from across the web.
If you’d like to share a chart or just say hello, email us at [email protected]