The Lag 7 Haven't Sunk the Ship 📈 The Chart Report

Chart of the Day
🏆 Today's Chart of the Day was shared by Phil Rosen.
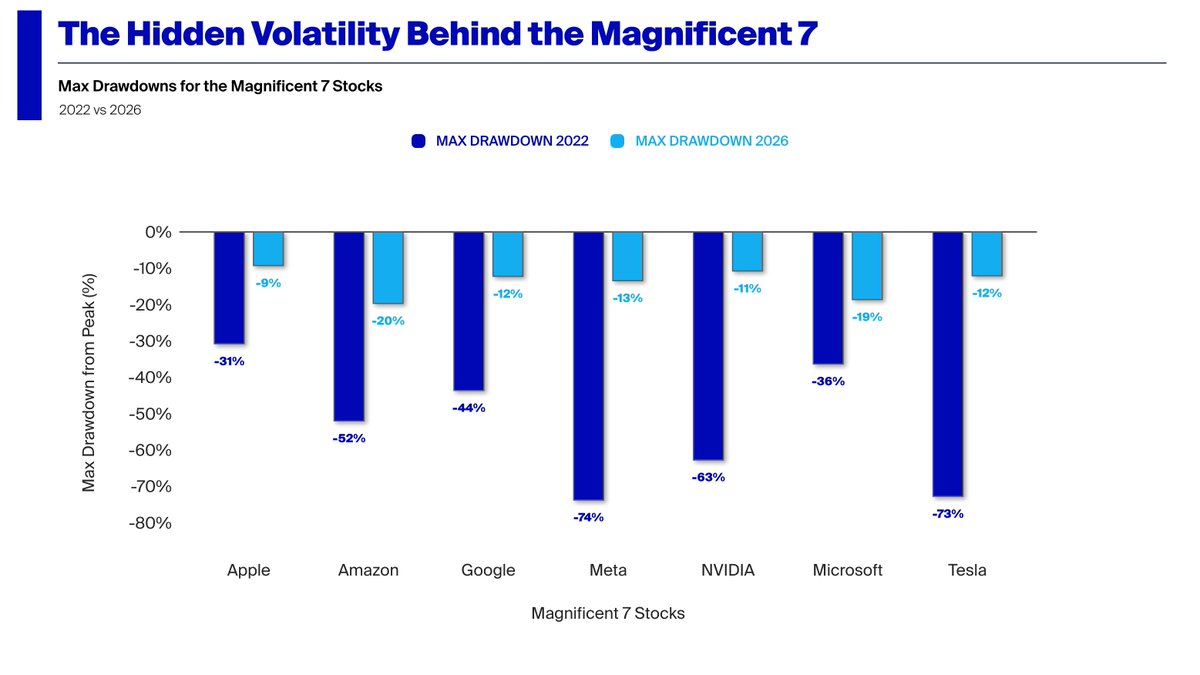
The Magnificent Seven are off to a rough start in 2026, with all seven currently in negative territory year-to-date.
Despite that early weakness, the impact on the broader market has been limited, as the S&P 500 remains less than 3% off its all-time highs.
We’re nowhere near the magnitude of the 2022 selloff, when these same companies experienced drawdowns ranging from 30% to north of 70%.
The Takeaway: Although the Magnificent Seven have stumbled out of the gate, broader market damage has been relatively contained.
More Great Charts
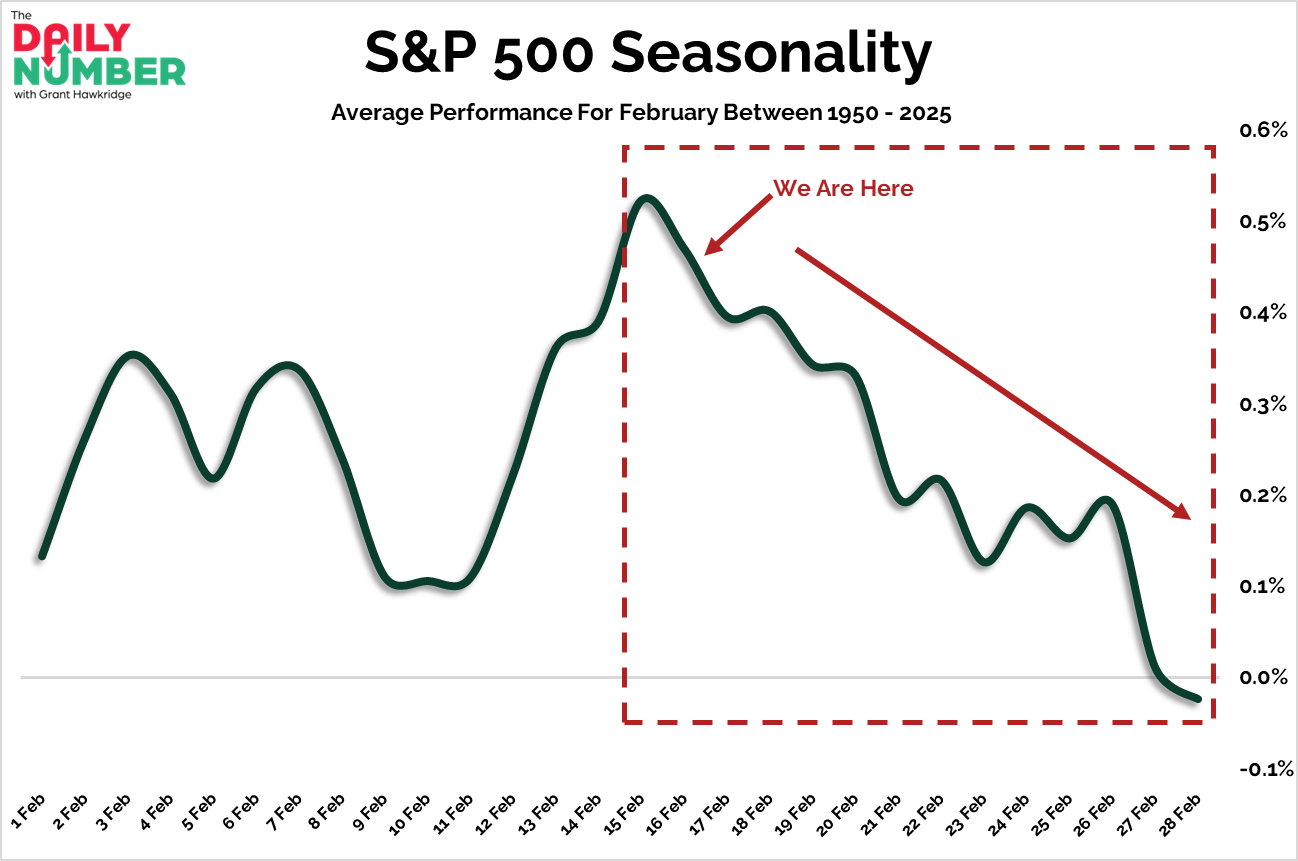
The back half of February has historically shown seasonal weakness, and we’re now in that window.
Grant Hawkridge breaks down the data.
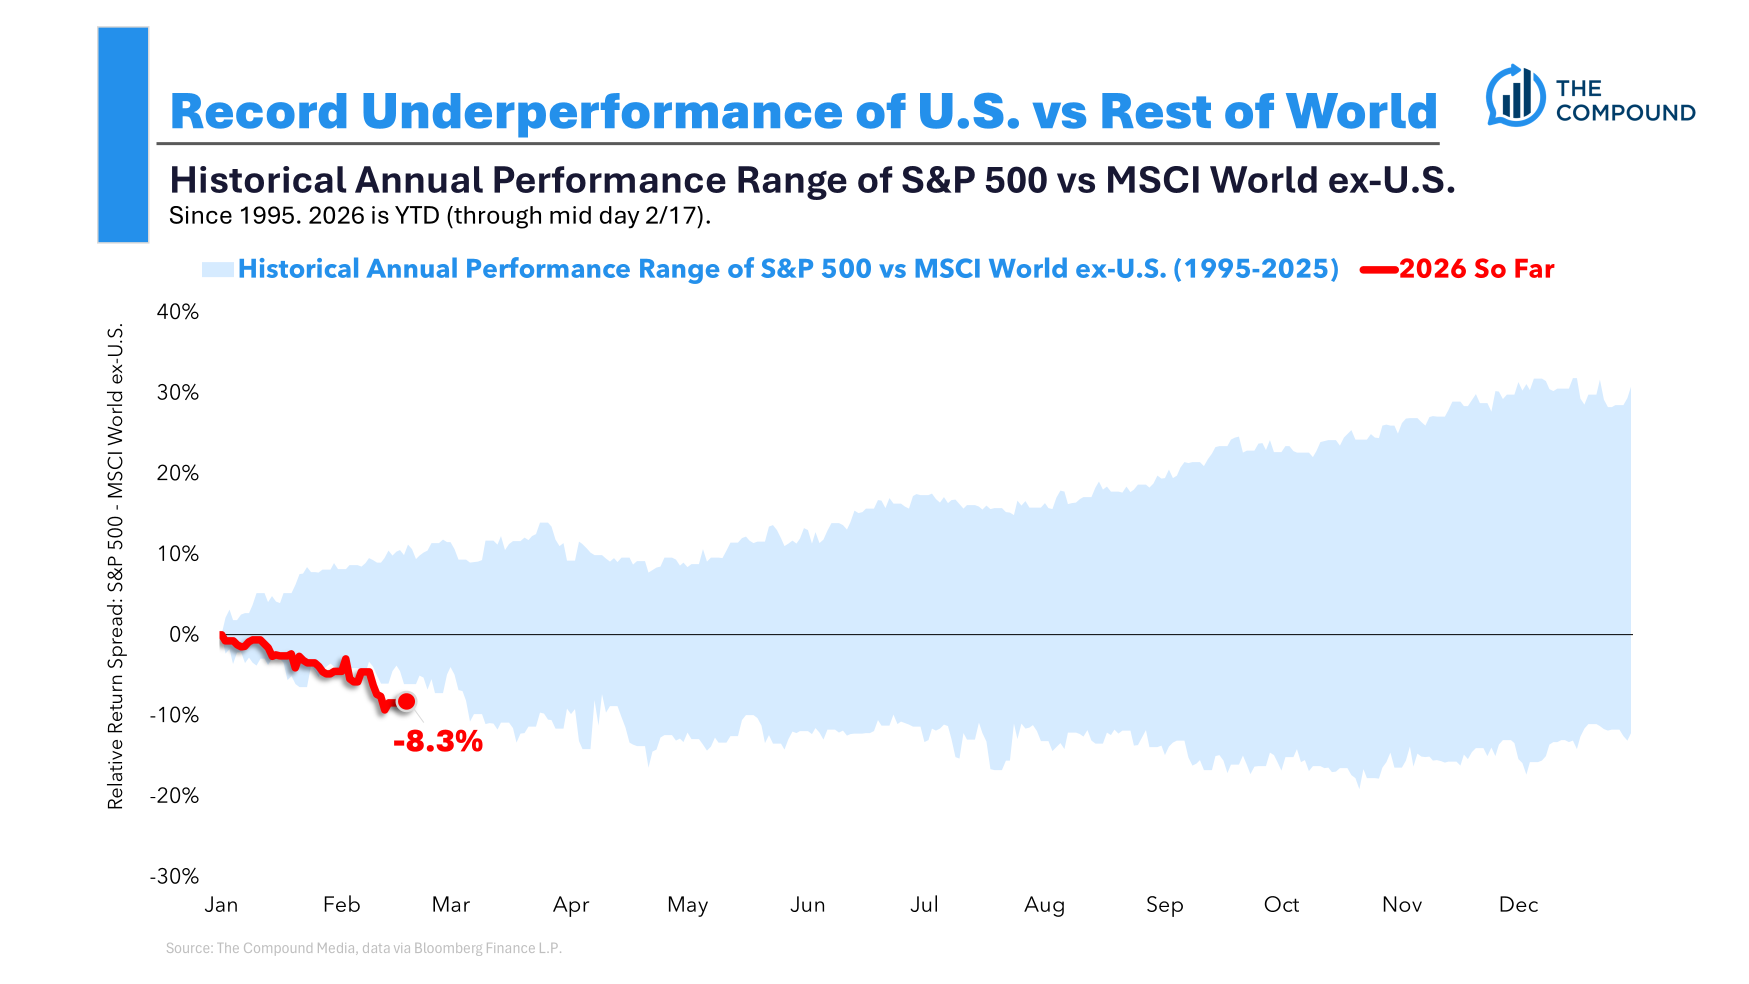
The S&P 500 is off to its weakest relative start versus global markets since 1995.
Ben Carlson puts this development into context.
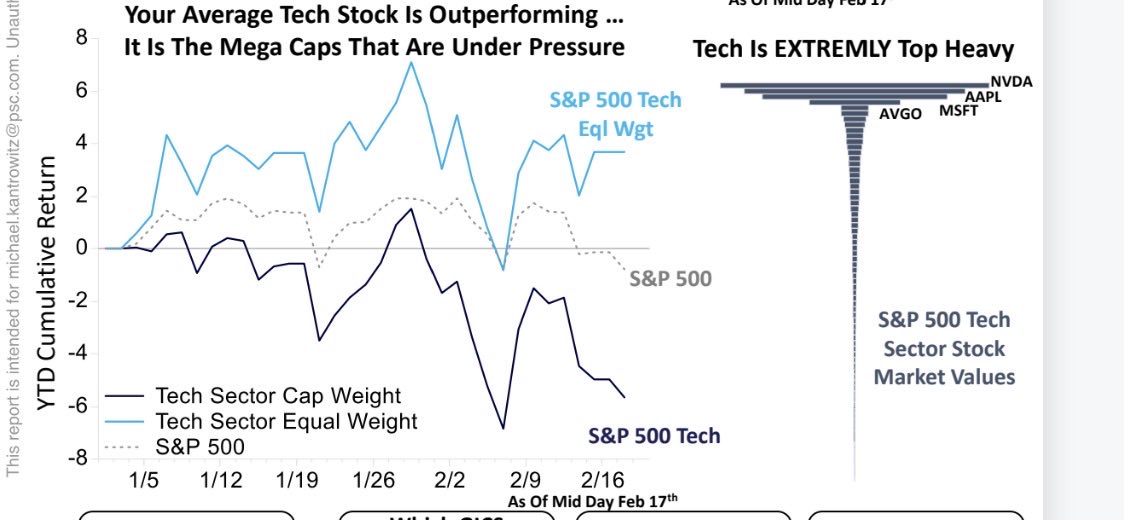
Technology’s recent underperformance is largely a cap-weight issue, as the average tech stock is still beating the S&P 500.
Check out Michael Kantro's full post.
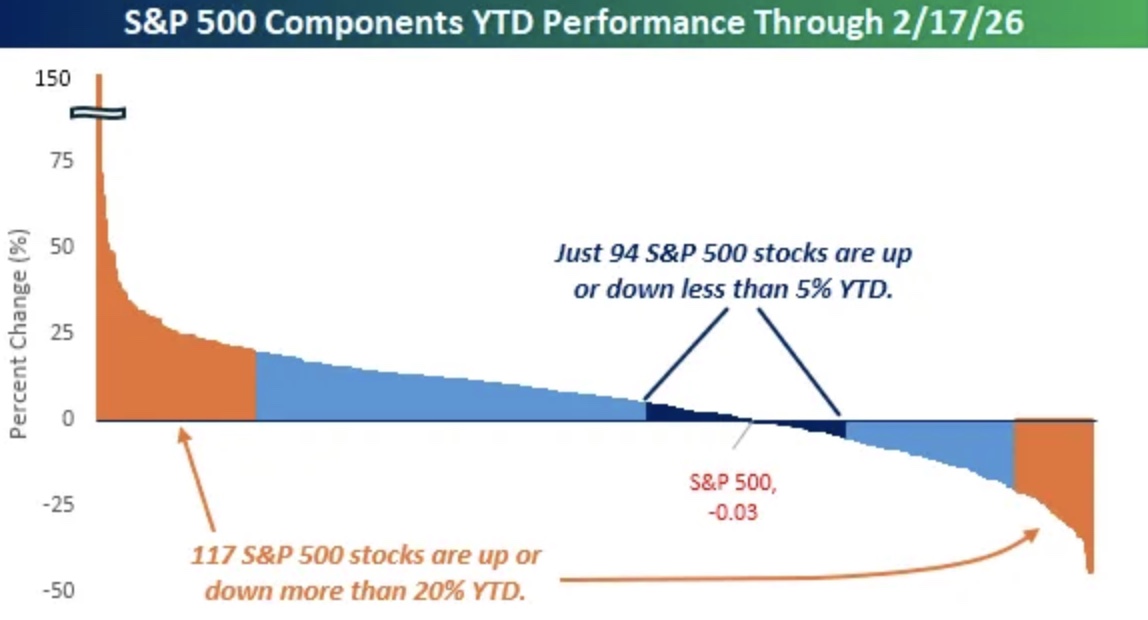
Even though the S&P 500 is flat on the year, 94 stocks are up or down less than 5% YTD, while 117 stocks have moved at least 20%.
Bespoke explores this dispersion in their morning note.
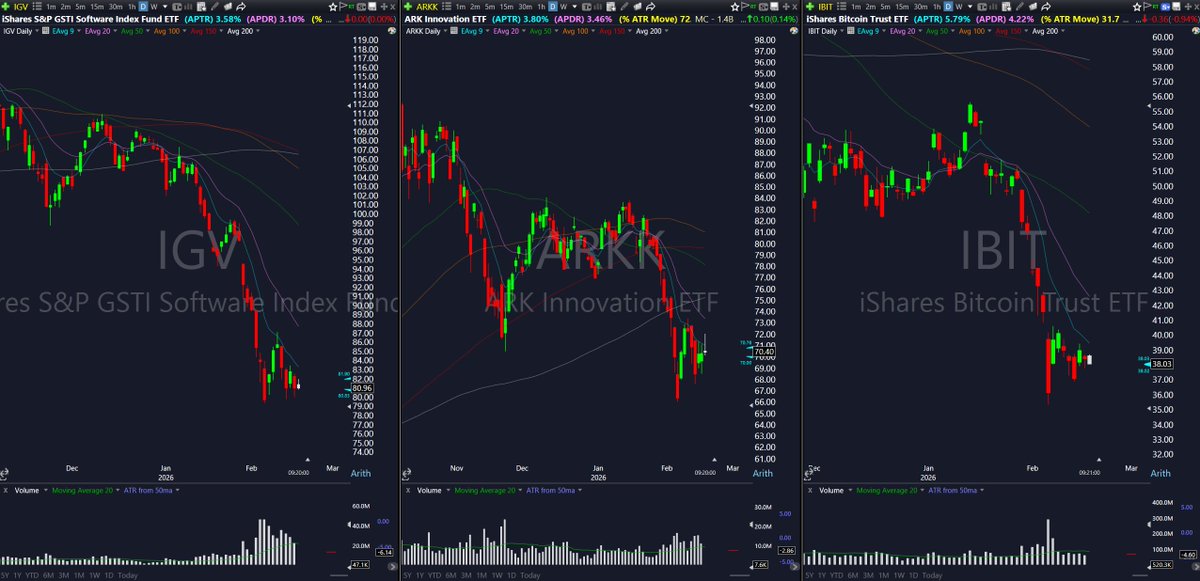
Software, speculative growth, and crypto are consolidating after leading the decline.
If these groups begin to reverse higher, it could offer clues about the market’s next move.
View Bracco's complete take.
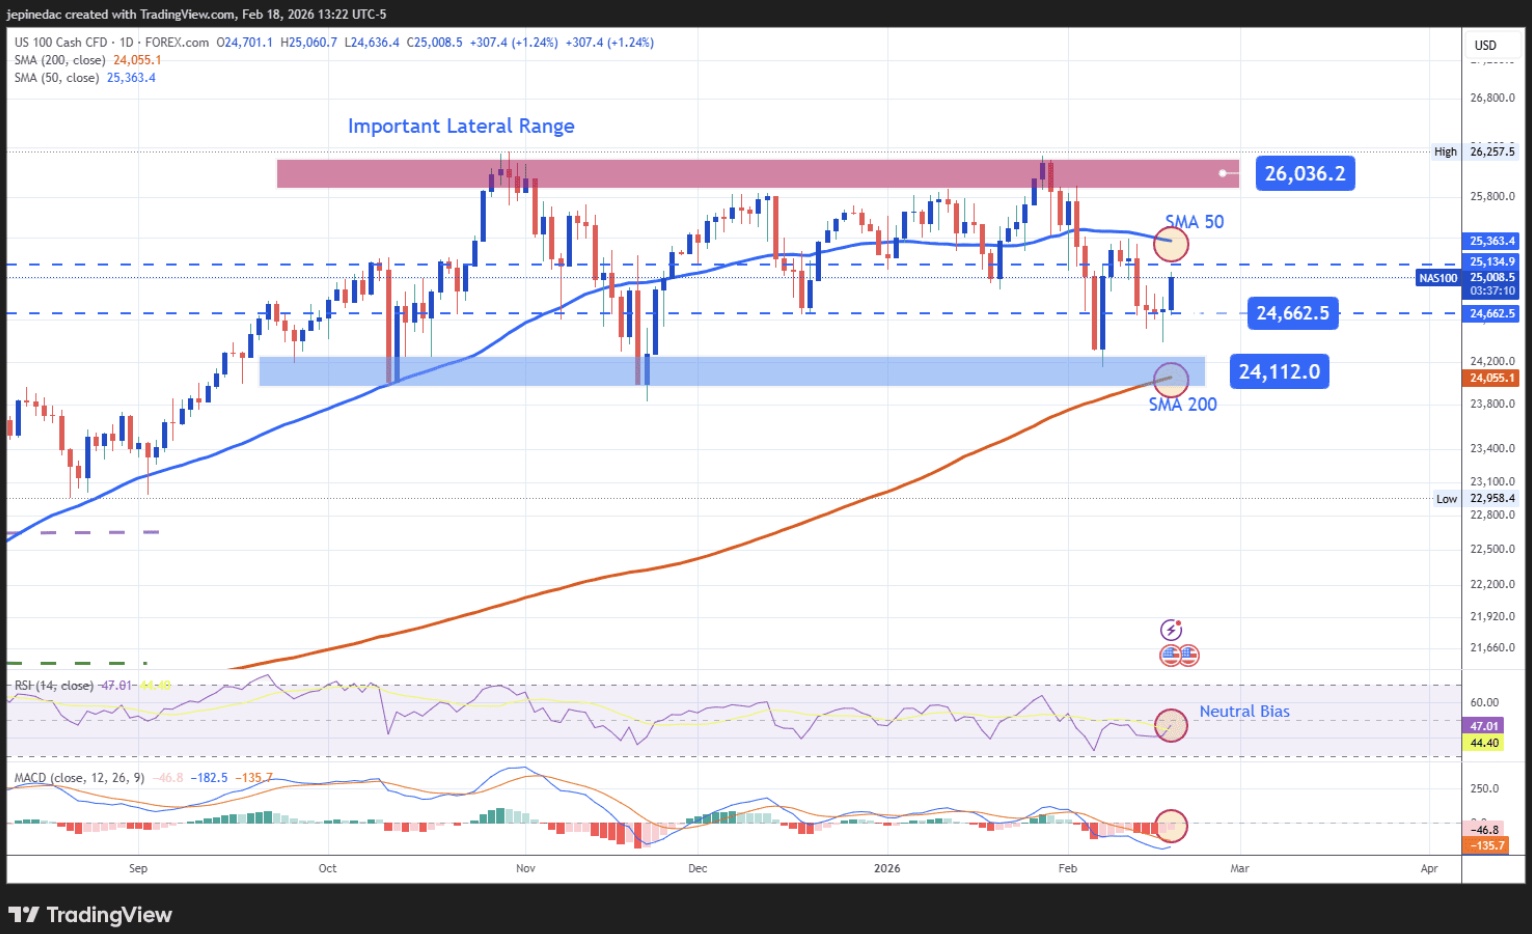
The Nasdaq remains locked in a broad range, with resistance near 26,000 and support around 24,000.
Read more of Julian Pineda's Nasdaq analysis.
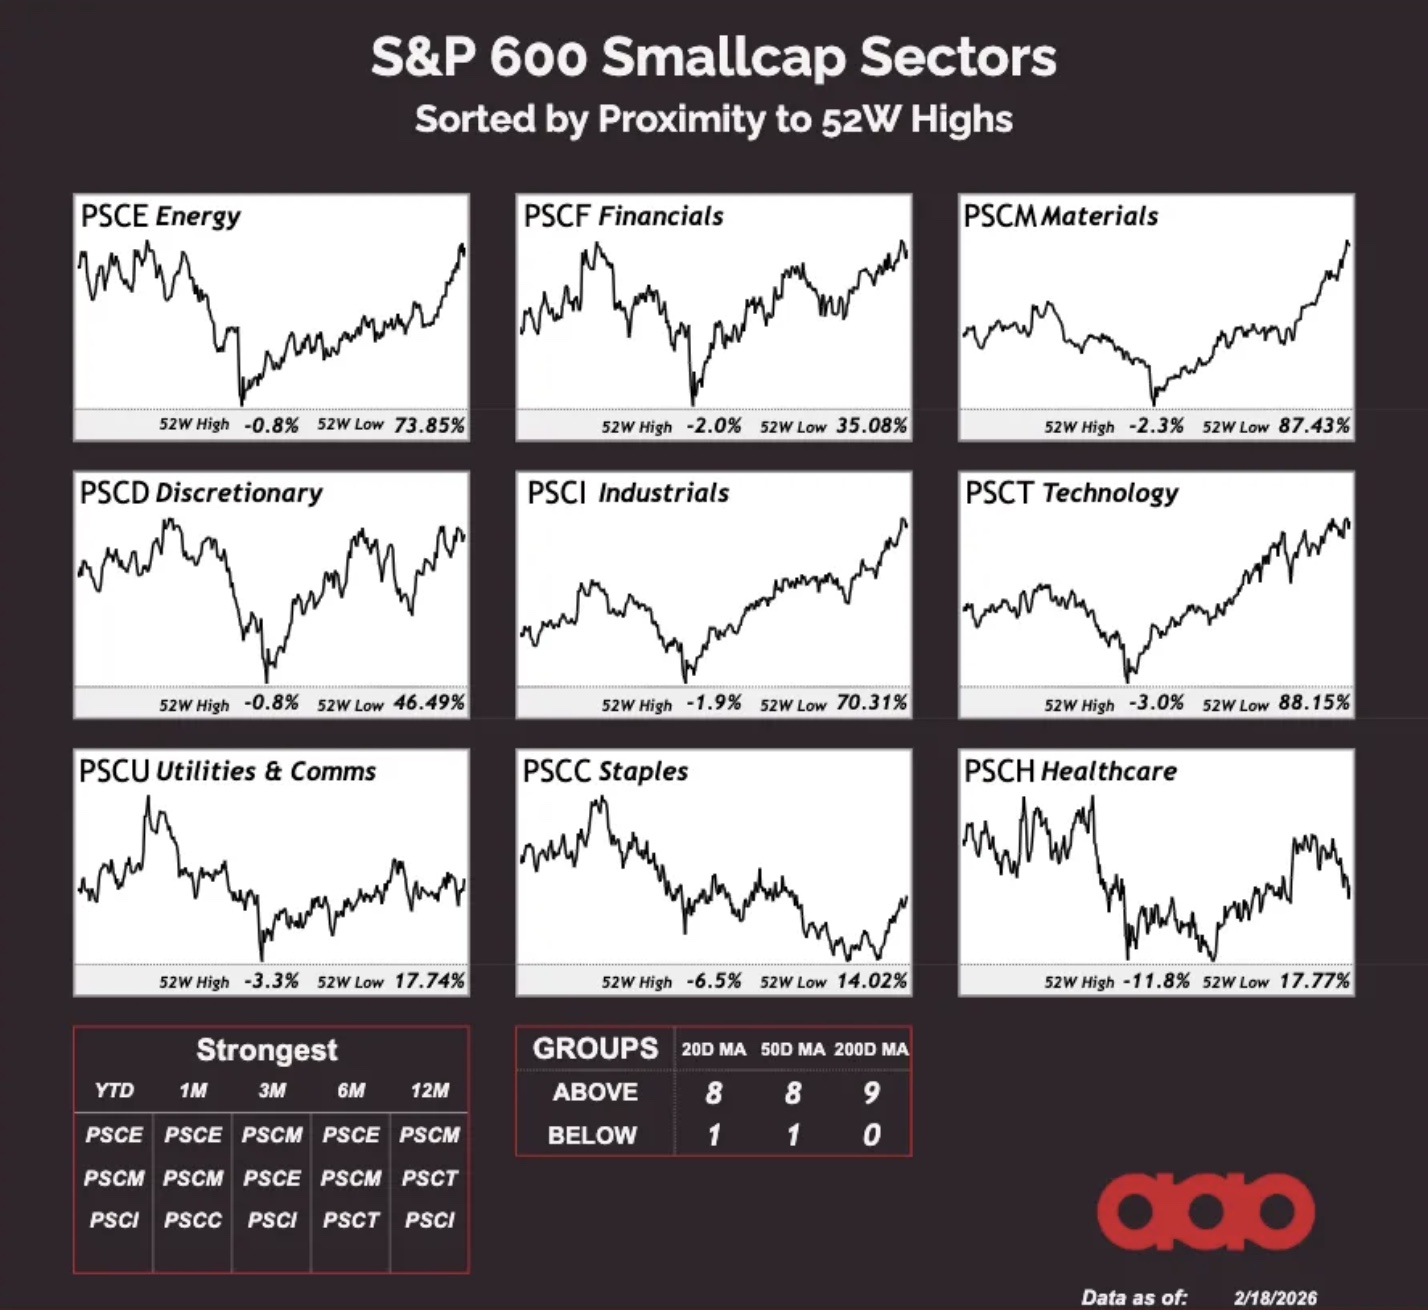
All nine small-cap sectors are trading above their 200-day moving averages, with eight also holding above their 20-day.
That’s broad participation by any definition.
Jason Perz walks through the implications in his latest article.
The Chart Report curates best-in-class technical analysis from across the web.
If you’d like to share a chart or just say hello, email us at [email protected]