Sponsored By:

Today’s Summary
Wednesday, May 22nd, 2019
Indices: US stocks were lower in today’s session, with the Dow Jones Industrial Average closing down 101 points or 0.39%. The Russell 2000 was the weakest among the major indices, finishing down 0.83%.
Sectors: Utilities led, gaining 0.83%. Energy lagged, falling 1.57%.
Commodities: WTI Crude Oil futures fell 2.74% to settle at $61.39 per barrel. Gold futures were flat and are trading at $1,275 per ounce.
Currencies: The US Dollar Index was mostly flat changing just 0.03%.
Interest Rates: The US 10-year Treasury Yield fell to 2.387%.
Here are some of the best charts, articles, and ideas being shared on the web today!
Chart of the Day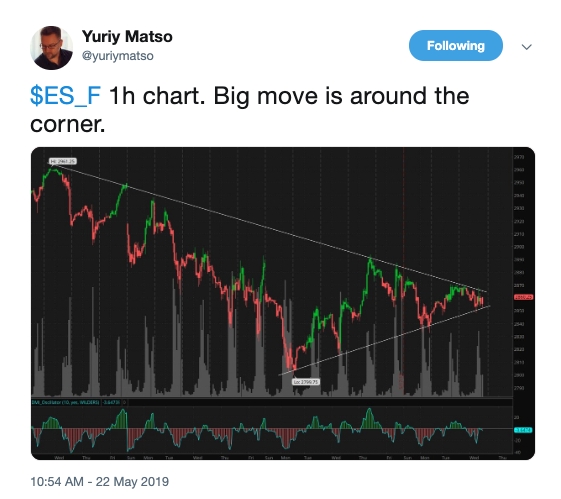
Today’s chart of the day was shared on Twitter by Yuriy Matso (@yuriymatso). It’s a candlestick chart of the S&P 500 futures with each candle representing one hour of price action. As you can see, price has worked its way into a triangle pattern with two converging trendlines. This pattern is often compared to the tightening of a coil whereas price moves in an increasingly tighter range until it reaches an equilibrium point or apex where a large move, up or down, is to be expected. Typically these patterns resolve in the direction of the underlying trend. However, rather than predicting which direction price will breakout, it’s more important to anticipate a large, energetic move out of this formation.
Quote of The Day
“Millions saw the apple fall, but Newton was the only one who asked why.”
– Bernard Baruch (American Investor)
LPL Financial emphasizes the fact this year, the S&P had its best first quarter since 1998. They include an interesting table to prove that a strong start to the year has historically signaled continued gains for the remainder of the year.
Silver Continues to Fall – Dragonfly Capital
Greg Harmon explains that Silver had the bulls excited at the beginning of the year as it moved over the 200-day moving average. However, It was unable to stay above it and has been slipping toward the Nov. 2018 low ever since.
Nifty Pattern Forming in this Foreign Market – Dana Lyons
Here’s a piece from Dana Lyons of J. Lyons Fund Management that highlights the bullish cup-&-handle chart pattern that’s currently forming in India’s Nifty 50 Index.
Julius de Kempenaer on Charting the Markets with RRG charts – IG.com
In this video, Julius de Kempenaer shows viewers how to use RRG charts. RRG or Relative Rotation Graphs are a unique way of visualizing relative strength and identifying sector/asset rotation.
Tesla Could Plummet Another 10% Before Finding a Bottom – CNBC
Shares of the electric car maker, Tesla ($TSLA) have been under pressure ever since breaking key support a few weeks ago. Ari Wald of Oppenheimer made an appearance on CNBC yesterday to explain why he thinks the chart is suggesting further downside.
Top 10 Tweets
The strength of the correlation between $SPX and $OIL is impressive and the 2 continue to trade together on the daily. The early part of the year saw copper and rates correlated to SPX as well but those since sold off.The top in stocks will come when oil fundamentals deteriorate pic.twitter.com/6EA0g0Sj52
— Adam Mancini (@AdamMancini4) May 22, 2019
$SPY has been choppy around todays VWAP but when you look at the 2 day VWAP (black) and 3 day VWAP (blue) you see more order pic.twitter.com/KlAlJ07ZZf
— Brian Shannon, CMT (@alphatrends) May 22, 2019
#Utilities and #Staples 2 defensive sectors outperforming in May. Tech making a rapid descent to weakest in May. More month to go though. #TDAEducation pic.twitter.com/sOmpz8KkI7
— Pat Mullaly, CMT (@PMullaly_TDA) May 22, 2019
The bulk of our industry group matrix is very bifurcated…Momentum is neutral and trends are all over the place. Who will emerge from the pack? pic.twitter.com/bqj32G6jBP
— Strategas (@StrategasRP) May 22, 2019
What is Dr. Copper telling us about the stock market and economy? pic.twitter.com/iZI1ioENkU
— Troy Bombardia (@bullmarketsco) May 22, 2019
$HG_F #Copper breaking down again, undercutting last week's lows- No real technical support here until prior lows, & better short than long near-term $COPX pic.twitter.com/cRsqQuG4QY
— Mark Newton (@MarkNewtonCMT) May 22, 2019
When Adobe when public in the summer of 1986, IBM was the largest company in the world. Returns since…$ADBE: +74,549%$IBM: +473% pic.twitter.com/Xt6USKq3Wo
— Charlie Bilello (@charliebilello) May 22, 2019
…and THIS, my friends, is why charts, trend-following, & technical analysis make so much sense.
Even when the bottom fell out to start the 4th quarter w/ the stock down -90%, analysts almost NEVER SAID "SELL!"
Concept developed by @tomdorsey w/ data from @DorseyWrightDWA pic.twitter.com/KLGLelxWa5
— Adam D. Koos, CFP®, CMT (@AdamKoos) May 22, 2019
Dear technicians, CMTs, etc
What would this formation in $QCOM be called? pic.twitter.com/UiNTSTBeFQ
— Michael Antonelli (@BullandBaird) May 22, 2019
might need a law degree to trade $QCOM pic.twitter.com/OP3MsN3Uii
— Rich Meatto (@koyfinTrader) May 22, 2019