Sponsored By:

Today’s Summary
Thursday, May 23rd, 2019
Indices: US stocks fell in today’s session with the Dow Jones Industrial Average closing down 286 points or 1.11%. The Russell 2000 was the weakest among the major indices, falling 1.97%.
Sectors: Utilities led for the second day in a row today, gaining 0.84%. Energy lagged for the second day in a row as well, falling 3.21%.
Commodities: WTI Crude Oil futures plunged 5.75% to settle at $57.91 per barrel. Gold futures were higher by 0.86% and are trading at $1,285 per ounce.
Currencies: The US Dollar Index fell 0.19%.
Interest Rates: The US 10-year Treasury Yield fell to its lowest level since 2017 at 2.322%.
Here are some of the best charts, articles, and ideas being shared on the web today!
Chart of the Day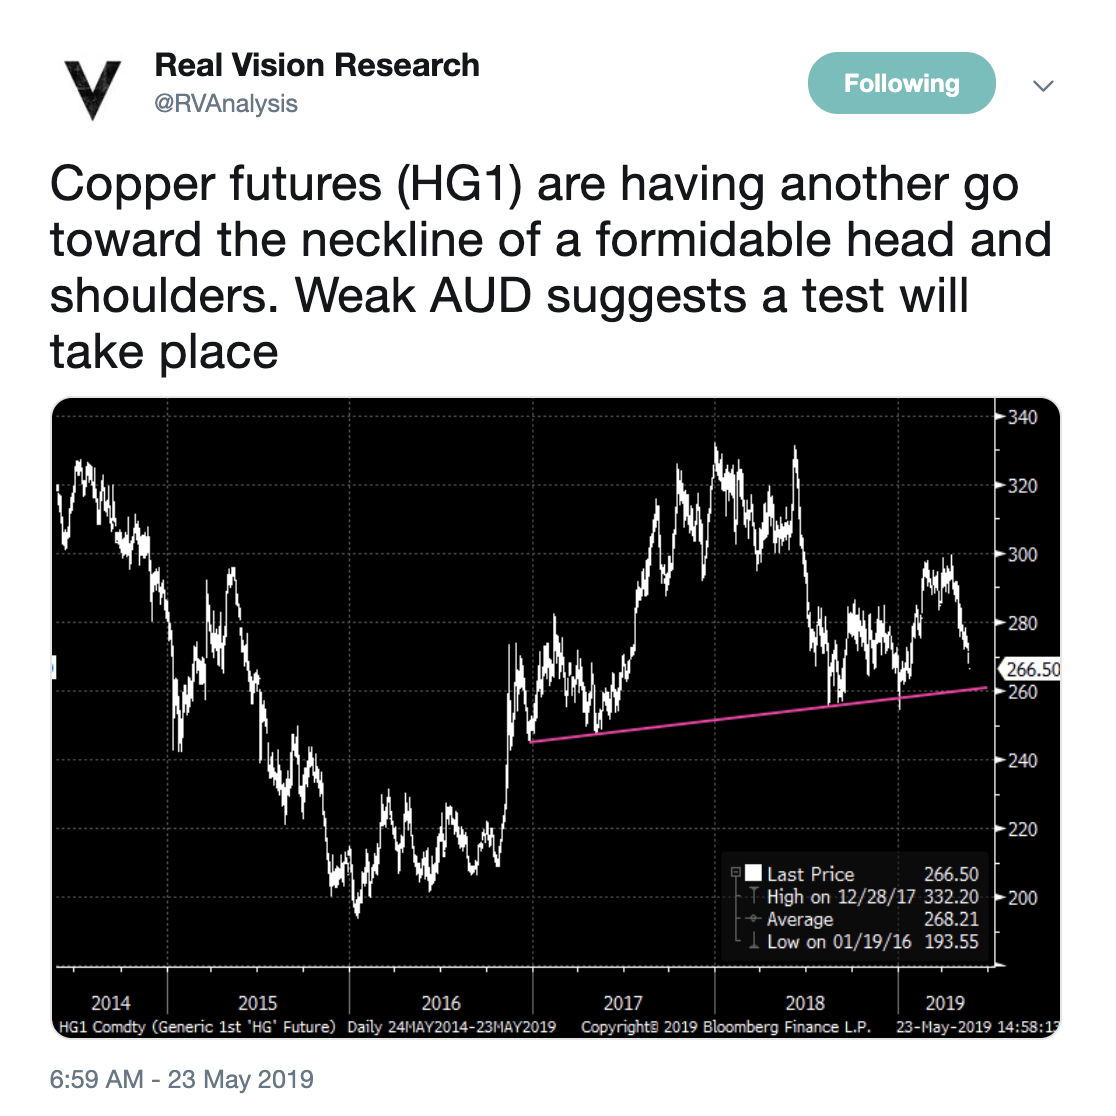
Today’s chart of the day was shared on Twitter by Real Vision Research (@RVAnalysis). It’s a chart showing the bearish head and shoulders pattern that’s forming on the chart of Copper Futures. Copper is often referred to as “Doc Copper” because it’s said to have a Ph.D. in economics due to its ability to predict booms and busts in the global economy. If the price falls below the pink ‘neckline’ on this chart, it would suggest further downside is likely. They add that weakness from the Aussie Dollar would put pressure on Copper as these two global risk assets are positively correlated. It’s important to keep an eye on this chart right now as continued weakness from Copper would be negative for global markets.
Quote of The Day
“Formal education will make you a living, self-education will make you a fortune”
– Jim Rohn (American Entrepreneur)
Here’s a quick video from David Keller of Sierra Alpha Research where he explains the tendency for people to be overactive with their investment decisions and trade compulsively. He argues that sometimes the best action is no action at all.
S&P 500: Buying the Potential Pullback – Real Vision
Joe Perry of ForexAnalytix made an appearance on Real Vision today to present his outlook on the S&P 500 and offer some key levels that traders and investors should be watching right now.
What the U.S. Dollar Rally Could Mean for Emerging-Market Equities – Bloomberg
Technical Analyst, Mark Newton joined host, Abigail Doolittle yesterday on Bloomberg to breakdown how continued strength from the US Dollar could impact Emerging-Markets.
The Trends We Indirectly Follow – Tom Bruni – All Star Charts
Tom Bruni rips through thousands of charts each week, across several different asset classes trying to piece together the puzzle that is the global markets. In this piece, he highlights some of the more prominent trends he’s been noticing lately.
A Perspective on the Crypto Markets from a Career Commodity Trader – Peter L. Brandt – Bitcoin Live
Legendary chartist and trader, Peter L. Brandt gave this presentation at the New York Consensus 2019 conference. He discusses how classic charting techniques can be applied to Cryptocurrency markets.
Top 10 Tweets
Breaking Below 200-Day Moving Averages Today: The DJ Transportation Average, the S&P 400 Mid-Cap Index and the Russell 2000. Now, watch their respective March lows – serous momentum losses are materializing.
— Ralph Acampora CMT (@Ralph_Acampora) May 23, 2019
A bounce or a break?
On the bright side, the old trenches are probably still there from the last time the market fought the battle of 2800… pic.twitter.com/27Su3HkEkQ
— Michael Santoli (@michaelsantoli) May 23, 2019
The moving averages on $IWM look very ominous…
Careful… no signs of short term bottom yet. pic.twitter.com/WjheWHaChd
— TradeTheTrader (@TradeTraders) May 23, 2019
Volatility of the VIX ($VVIX) never got high enough to confirm the higher high that was taking place in the $VIX today. Same type of setup took place on May 9th. pic.twitter.com/qs0hMbSAgZ
— Andrew Thrasher, CMT (@AndrewThrasher) May 23, 2019
Headlines are scary and days like this are scary.
Which makes it very important to remember that the average year sees the S&P 500 pullback 5% more than 3 times on average.
We still haven't even had 1 in 2019 yet… pic.twitter.com/HJSKM0fozX
— Ryan Detrick, CMT (@RyanDetrick) May 23, 2019
Another big move ? in crude today!#WTI 2-day ROC down more than 8%
That's only happened 12 other times since Jan 2010.#OOTT #CL_F $USO pic.twitter.com/z708FLo2e0
— I. Vodenitcharov, CFA, CMT (@iv_technicals) May 23, 2019
$DXY attempting to break above key resistance at 98 again (now at 98.20). I would like to see RSI close above the downtrend line for confirmation that this is for real this time. #dollar #usd #gold $GLD $SLV pic.twitter.com/LaKqcqybXk
— Tarek I. Saab (@FibLines) May 23, 2019
You realize the S&P was lower 10 days ago right? pic.twitter.com/SssPyDt0jS
— Bespoke (@bespokeinvest) May 23, 2019
Yields on 10-year Treasuries are now at the lowest since late 2017. pic.twitter.com/Gb7wAA6ghY
— Lisa Abramowicz (@lisaabramowicz1) May 23, 2019
"Yields HAVE to start going up"
Going on 38 years of being wrong
(US 10yr yield) pic.twitter.com/4Jzyyya7ij
— Michael Antonelli (@BullandBaird) May 23, 2019