Sponsored By:

Today’s Summary
Thursday, May 30th, 2019
Indices: US stocks closed higher in today’s session, with the Dow Jones Industrial Average advancing 43 points or 0.17%. The Russell 2000 was the weakest of the major indices, falling 0.30%.
Sectors: Technology led, gaining 0.62%. Energy lagged falling 1.27%.
Commodities: WTI Crude Oil futures dropped 3.89% to settle at $56.59 per barrel. Gold futures were higher by 0.54%, and are trading around $1,293 per ounce.
Currencies: The US Dollar Index was unchanged.
Interest Rates: The US 10-year Treasury Yield fell to a 20-month low of 2.217%
Here are some of the best charts, articles, and ideas being shared on the web today!
Chart of the Day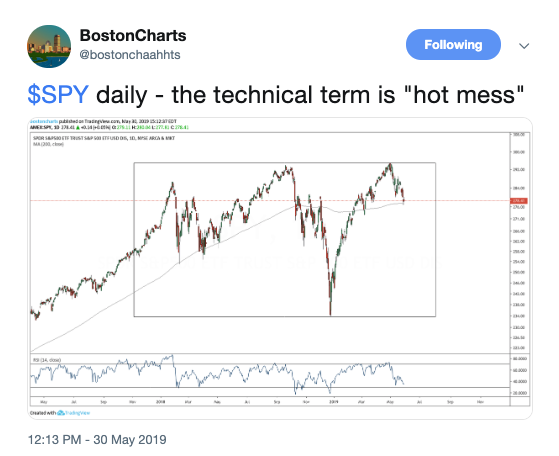
Today’s chart of the day was shared on Twitter by @bostonchaahhts. It’s a candlestick chart of the S&P 500 sitting right at a flat 200-day moving average. He calls this chart a “hot mess” because the flat 200-day moving average suggests a trendless, choppy market environment. Markets become harder to predict in the absence of a trend. As you can see, we’ve been unable to establish a clear uptrend or downtrend for over a year now. The only thing one can expect from this sort of environment is sideways, messy price action.
Quote of The Day
“In any sector, trade the leading stock – the one showing the strongest trend”
– Jesse Livermore (American Investor)
In this report, we cover Katie Stockton’s current outlook on the US Equity market. Katie thinks the S&P 500 could continue to weaken in the short-term, but is bullish longer-term and thinks the 2720 level will act as support. SOX close to Bear Market Might be a Tell on the S&P 500 – Dan Russo – Bloomberg
Dan Russo of Chaikin Analytics joined host Abigail Doolittle on Bloomberg yesterday to talk Semiconductor stocks and how they could potentially weigh-down the broader market. He also gives his thoughts on Bonds and the Real Estate sector.
Did We Just Complete a H&S Top in $SPX? – Julius de Kempenaer – StockCharts.com
There has been a lot of chatter about a potential head & shoulders top forming on the chart of the S&P 500 right now. In this piece, Julius de Kempenaer examines this chart pattern and gives his downside price target.
Time for a June Swoon? – LPL Financial Research
Here’s a research note from LPL Financial that takes a look at how the market typically performs in the month of June. They point out that June is the second worst performing month on average for the S&P 500 and that its especially weak after a big drop in May.
Playing Corn’s Pop – Real Vision
John Roque of Wolfe Research was featured on Real Vision’s Trade Ideas segment today where he presented his bullish thesis on Corn.
Top 10 Tweets
Yesterday witnessed serious technical damage in most of the market's leading indexes; for example, the DJ Industrials along with the S&P 500 broke their March lows and completed head & shoulders top patterns. They are also below their 200-day moving averages.
— Ralph Acampora CMT (@Ralph_Acampora) May 30, 2019
$IWM 4-month low pic.twitter.com/F75fjhibdq
— Mike Zaccardi, CFA, CMT (@MikeZaccardi) May 30, 2019
This chart should worry all of the tech bulls… It depicts a pretty spectacular bearish divergence between Nasdaq and its bullish percent index. pic.twitter.com/Y1ASQG5Wfe
— Yuriy Matso (@yuriymatso) May 30, 2019
Yields on 30-year Treasuries have fallen to the lowest since 2016. pic.twitter.com/inltYUlQme
— Lisa Abramowicz (@lisaabramowicz1) May 30, 2019
Here are the returns for various markets, indices, and interest rates so far this May
Spot the odd one(s) out pic.twitter.com/Bd6eQuFPTG
— Troy Bombardia (@bullmarketsco) May 30, 2019
The S&P 500 is now in a peak-to-trough drawdown of more than 5%
This is something that has happened 65 of the last 70 years
The only years w/o a 5% correction since 1950: 1954, 1958, 1964, 1995, 2017 pic.twitter.com/xAW4aCFucr
— Ben Carlson (@awealthofcs) May 29, 2019
The top performing country ETF in 2019?
Greece. +29% YTD, 9-month high today. $GREK pic.twitter.com/ECEi4XHn78
— Charlie Bilello (@charliebilello) May 30, 2019
Yesterday’s pullback in #corn took it right back to the 2018 high. (Old resistance, once broken, becomes new support). The mkt held and started firming this morning. I’m buying w/ a stop under yesterday’s low and adding on the way up! #trendfollowing pic.twitter.com/idy2y5Lx17
— Jason Pearce (@TheJaytrader) May 30, 2019
#RIPPLE $XRPUSD shaping up nicely Technically here after 6 month breakout consolidated, and now exceeding mid-May highs on a closing basis- I have owned since mid-May #LONG pic.twitter.com/0YgD6hx4dU
— Mark Newton (@MarkNewtonCMT) May 30, 2019
lol $BTC trades 9 handle and 7 handle, 5 hours apart. pic.twitter.com/5lJVvSbiw9
— Chris Carolan (@spiralcal) May 30, 2019