Sponsored By:

Today’s Summary
Friday, May 31st, 2019
Indices: US stocks closed lower in today’s session, with the Dow Jones Industrial Average falling 355 points or 1.41%. The Nasdaq was the weakest of the major indices, falling 1.51%.
Sectors: Real Estate led, gaining 0.80%. Energy lagged falling 1.76%.
Commodities: WTI Crude Oil futures tumbled 5.48% to settle at $53.50 per barrel. Gold futures were higher by 1.38%, and are trading around $1,310 per ounce.
Currencies: The US Dollar Index fell 0.39%.
Interest Rates: The US 10-year Treasury Yield fell to a 20-month low of 2.133%
Here are some of the best charts, articles, and ideas being shared on the web today!
Chart of the Day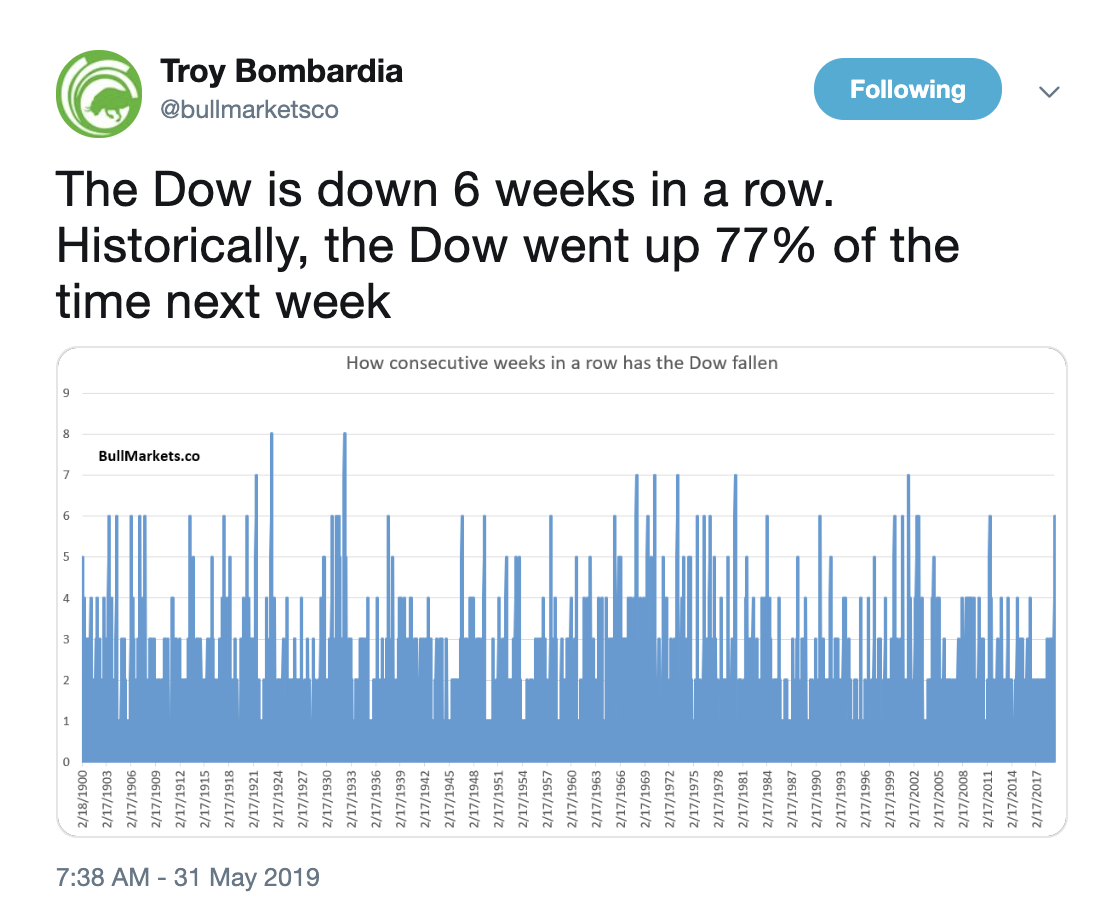
Today’s chart of the day was shared on Twitter by Troy Bombardia (@bullmarketco). It’s a chart showing the longest losing streaks for the Dow Jones Industrial Average since 1900. This week marks the sixth consecutive weekly loss for the index, the longest losing streak since 2011. On a brighter note, Troy points out that historically, the Dow is positive a majority of the time, the week after a losing streak of this magnitude. Furthermore, in a note from bespoke, they say eight-week losing streaks are ” practically unheard of.“
Quote of The Day
“Sometimes the questions are complicated and the answers are simple.”
– Dr. Seuss (American Author)
Here’s a research note from investment strategist, Willie Delwiche of RW Baird & co. He uses several charts to show that breadth is deteriorating in both foreign and domestic equity markets.
A Contrarian Indicator Shows the Market Sell-off May be Closer to the End Than the Beginning – CNBC
In this quick read from CNBC, they feature research from Todd Sohn of Strategas. Todd explains that while the sell-off may not be over just yet, the put/call ratio is beginning to show signs that we may be near a short-term bottom.
Stock Market Analysis May 31, 2019 – Brian Shannon
Here is Brian Shannon’s weekly market video where he recaps this past week and gives his outlook for the week ahead.
Key Moving Average Rolls Over for S&P 500 – StockCharts.com
Arthur Hill of StockCharts.com analyzes the trends of the S&P 500, S&P Mid-Cap 400, and the S&P Small-Cap 600 indices. He argues that all three have entered into long-term downtrends now that they’ve fallen below their downward sloping 200-day moving averages.
DJIA Six Week Lossing Streaks – Bespoke
The Dow Jones Industrial Average booked its sixth straight weekly loss today. This is now the longest losing streak for the index since 2011. Bespoke points out that it’s rare to see seven straight weekly losses and eight is nearly unheard of.
Top 10 Tweets
Succinct Summations of Week’s Events 5.31.19 https://t.co/0uJb05wrBX pic.twitter.com/ulZNdXpxJU
— Barry Ritholtz (@ritholtz) May 31, 2019
Wow, can’t say this often but May 1st $SPY opened on the high tick for the month and May 31st closed on the low tick. Impressive. pic.twitter.com/4GNimysZKh
— Sean McLaughlin, NLD ? (@chicagosean) May 31, 2019
May$SPY -5.63%
Real Estate $XLRE +1.19%
Utilities $XLU +0.24%Healthcare $XLV -2.04%
Cons Stap $XLP -2.44%
Comm $XLC -5.46%
Financials $XLF -6.41%
Cons Disc $XLY -6.47%
Materials $XLB -6.47%
Industrials $XLI -7.02%
Tech $XLK -8.41%
Energy $XLE -9.29%https://t.co/bHLmkjb65K pic.twitter.com/tNU1g3wThb— Rich Meatto (@koyfinTrader) May 31, 2019
$BTC appears to be stabilizing after the 12% break on Thursday. I am willing to dip by toes back in the water. pic.twitter.com/wjoPKfY34c
— Peter Brandt (@PeterLBrandt) May 31, 2019
Gold's "Cup and Handle" – Finally pricing in rate cuts… pic.twitter.com/Bjx4j4CHfG
— Lawrence McDonald (@Convertbond) May 31, 2019
Breadth is threatening to break down (% of NYSE stocks > 200day MAVG)
I assume after today it'll break that level pic.twitter.com/OX7UmwVDKz
— Michael Antonelli (@BullandBaird) May 31, 2019
I find it really interesting that Vol of VIX is still not matching the higher highs that $VIX is displaying. $VVIX $VIX pic.twitter.com/l28t7d4R3N
— Andrew Thrasher, CMT (@AndrewThrasher) May 31, 2019
$TLT up 6% since that massive record inflow on 4/18 pic.twitter.com/vintjVKpwL
— Athanasios (Tom) Psarofagis (@tpsarofagis) May 31, 2019
Junk Bond ETF vs 20+Yr US Govt ETF was a factor in cautious bias pic.twitter.com/T1U0poTsjV
— Thomas Thornton (@TommyThornton) May 31, 2019
My avocado-based quant model says buy Bitcoin based on the Mexico tariffs news. pic.twitter.com/e7Ram1Qg1x
— Tracy Alloway (@tracyalloway) May 31, 2019