Sponsored By:

Today’s Summary
Monday, May 13th, 2019
Indices: US stocks had their worst day since January, with the Dow Jones Industrial Average closing down 617 points or 2.38%! The Nasdaq was the weakest of the major indices, closing down 3.41%.
Sectors: Utilities led for the second session in a row, gaining 1.07%.Technology lagged closing down 3.77%.
Commodities: WTI Crude Oil futures fell 1.33% and closed at $60.84 per barrel. Gold futures were higher by 1.05% and are trading around $1,301 per ounce.
Currencies: The US Dollar Index fell 0.04%.
Interest Rates: The US 10-year Treasury Yield fell to 2.403%.
Here are some of the best charts, articles, and ideas being shared on the web today!
Chart of the Day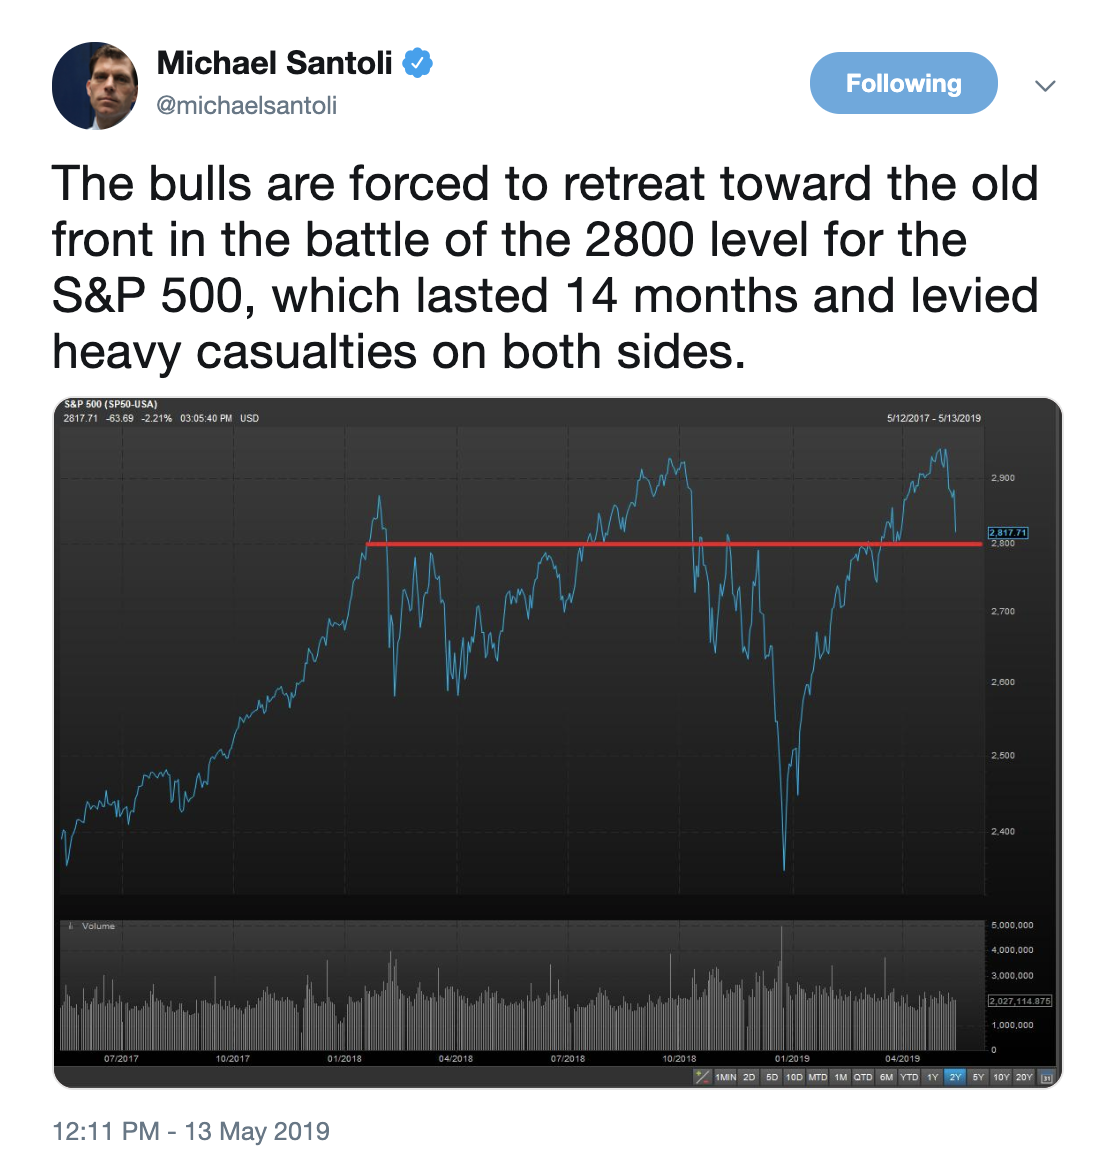
Today’s chart of the day was shared on Twitter by CNBC’s Michael Santoli (@michaelsantoli). It’s a line chart of the S&P 500 index with the 2800 level drawn in red. 2800 has been a key level of interest for the S&P 500 for over a year now. It previously acted as resistance, with the index bouncing lower off of it four times before finally breaking through and going on to hit a new all-time high. The question on many technicians minds’ remains: will former resistance now act as support? We want to hear what you think, tweet us @TheChartReport.
Quote of The Day
“In the investment business, you must expect to be wrong“
– Barry Ritholtz (Investor, Author)
This week’s chart of the week is the New Zealand ETF (ENZL). We like this chart because it’s one of the strongest uptrends out of any foreign ETF and momentum is showing near-term relative strength.
Here’s a report from our newest contributor, Dan Gorghuber. In the report, Dan suggests the Dow might need a ‘spring cleanup’ after a strong start to the year. He discusses Wal-Mart ($WMT), Boeing ($BA), and the insurance company, Travelers ($TRV).
Three Bright Spots Outside the United States – David Keller – StockCharts.com
Here’s a great read that was shared over the weekend by David Keller. The article focuses on the foreign equity markets that are showing the most attractive risk/reward opportunities right now.
Dow Jones Industrial Average Triple Topping at Key Fib Price Level – Chris Kimble
Chris Kimble points out a potential triple-top formation in the Dow Jones Industrial Average. This formation is happening right at the 261.8% Fibonacci extension from the 2008 financial crisis.
S&P 500 Performance After 1%+ Lower Opens – Bespoke
The S&P 500 gapped lower today by over 1%. Here’s a note from Bespoke that features a chart of the average weekly performance for the S&P 500 after a gap down of 1% or more. They found that buyers typically step in on Tuesdays and Fridays.
Top 10 Tweets
The good news is that there's no such thing as a "triple top", right? $SPX pic.twitter.com/wL26BoxhcB
— I. Vodenitcharov, CFA, CMT (@iv_technicals) May 13, 2019
Managed to hold this area, @allstarcharts would tell us there's a lot of memory around 2,800$SPX pic.twitter.com/9nmeRXKnh6
— Michael Antonelli (@BullandBaird) May 13, 2019
The bulls are forced to retreat toward the old front in the battle of the 2800 level for the S&P 500, which lasted 14 months and levied heavy casualties on both sides. pic.twitter.com/HL9PyNw5iZ
— Michael Santoli (@michaelsantoli) May 13, 2019
Fund flows have been negative for this entire rally. I wonder how many investors 1. "have been waiting for a correction" and 2. will actually act on their "patience" now that we're getting a sell-off? pic.twitter.com/2icNd3KZKd
— Tony Welch, CFA, CMT (@tonywelch17) May 13, 2019
S&P 500: this is the 24th correction >5% since the March 2009 low. They all seemed like the end of the world at the time. $SPX pic.twitter.com/dfavEqab1I
— Charlie Bilello (@charliebilello) May 13, 2019
Yields on 2-year Treasuries back down at the lowest levels since February 2018. pic.twitter.com/K3gQ3UNkRV
— Lisa Abramowicz (@lisaabramowicz1) May 13, 2019
No place like home…
5-Year Performance$SPY (US) +63.40%$EFA (Developed Mkts) +7.62%$EEM (Emerging Mkts) +6.25%$FM (Frontier Mkts) -7.43%https://t.co/L00ILvk3ac pic.twitter.com/KsdRrq0OX9
— Rich Meatto (@koyfinTrader) May 13, 2019
$TSLA at VWAP from the IPO in 2010, will it matter? no position for me pic.twitter.com/iTi8fgbNbV
— Brian Shannon, CMT (@alphatrends) May 13, 2019
#bitcoin $XBT $BTC pic.twitter.com/ba2UxtuF2n
— Dow (@mark_dow) May 13, 2019
Bitcoin is acting more like gold than gold
— Aaron (@ATMcharts) May 13, 2019