Sponsored By:

Today’s Summary
Friday, May 17th, 2019
Indices: US stocks were lower in today’s session, with the Dow Jones Industrial Average falling 99 points or 0.38%. The Russell 2000 was the worst of the major indices, falling 1.38%.
Sectors: Utilities were the only positive sector, closing up 0.51%. Industrials lagged, falling 1.11%.
Commodities: WTI Crude Oil futures fell 0.25% to settle at $62.71 per barrel. Gold futures fell 0.68% to $1,277 per ounce.
Currencies: The US Dollar Index was higher by 0.16%.
Interest Rates: The US 10-year Treasury Yield fell to 2.393%.
Here are some of the best charts, articles, and ideas being shared on the web today!
Chart of the Day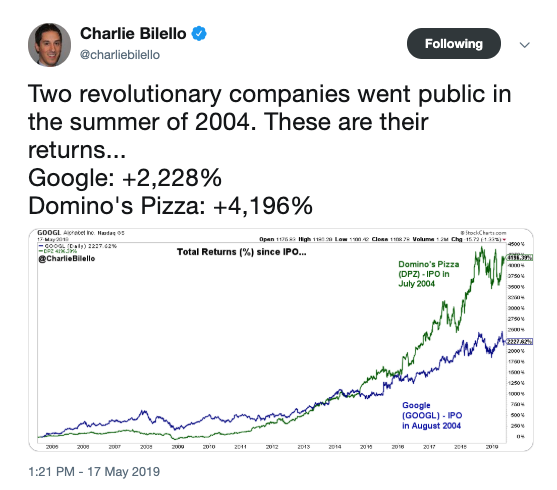
Today’s chart of the day was shared on Twitter by Charlie Bilello (@charliebilello). It’s a line chart showing the performance of Google ($GOOGL) in blue, and Domino’s Pizza ($DPZ) in green. The chart goes all the way back to 2004, the year both companies went public. It might come as a surprise to learn that a company that serves mediocre pizza at best, has significantly outperformed one of the markets most beloved tech companies. It’s interesting to see that Google was steadily outperforming Domino’s until about 2015 when Domino’s took the reigns and began to take flight.
Quote of The Day
“When you’re one step ahead of the crowd you’re a genius. When you’re two steps ahead, you’re a crackpot.”
– Shlomo Riskin (Rabbi)
Technical Analyst, Tom Bruni made an appearance on Real Vision to present a trade idea on a commodity that he’s bullish on. He explains that Palladium continues to be in an uptrend and thinks the precious metal has further upside from here.
Dollar on its Way to 2-year High – Dragonfly Capital
Greg Harmon of Dragonfly Capital points out that the US Dollar is on the verge of breaking out to a new 2-year high. He thinks the chart of the US Dollar index is shaping up for its next leg higher.
A Bearish Failure Swing for the Russell 2000 – StockCharts.com
In this article, Arthur Hill of StockCharts.com points out that the small-cap Russell 2000 just flashed a bearish failure swing. He explains what this RSI signal means and how it’s different from a bearish divergence.
Has Beating The Market Gotten Harder? – Howard Lindzon
Here’s an interesting read/exercise from Howard Lindzon. He uses three charts, each showing the performance of $SPY versus the performance of Berkshire Hathaway. Each chart is in a different time frame and is captioned with a different narrative.
Stock Stand Tall Against Headwinds – LPL Financial Research
As the US 10-year treasury yield hovers near 52-week lows, China has cut its holdings of US Treasury Securities to a near 2-year low. LPL Financial Research found that while China has been selling US debt, Japan has quietly been buying.
Top 10 Tweets
Expect further consolidation as the market tries to digest the conflicting events including China/tariffs, Iran/potential war, North Korean/missile testing, etc. Good – the market's December lows are holding – but we need to see new all-time highs to re-establish the bull trend.
— Ralph Acampora CMT (@Ralph_Acampora) May 17, 2019
This was the first 4-week losing streak for the Dow in 3 years.
Hasn't been down 5 weeks in a row in 8 years! pic.twitter.com/LmDjusW6D0
— Ryan Detrick, CMT (@RyanDetrick) May 17, 2019
For a second straight Friday, the market has a shot to settle right at the January 2018 high of 2872 – still the momentum, valuation and sentiment peak of this bull market so far. pic.twitter.com/WQs7t4d2kT
— Michael Santoli (@michaelsantoli) May 17, 2019
#DrSilicon not happy: pic.twitter.com/vvPceTXgjd
— Walter Deemer (@WalterDeemer) May 17, 2019
It seems pretty normal to me that a high-volatility, high-RS group such as semiconductor stocks would pull back to their Sept high in a market like we've seen this past two weeks.
I see no neg divergence, momentum range remains bullish, & RS is long-term strong.$XSD $SMH $SOXX pic.twitter.com/bIWiviVOuE
— Adam D. Koos, CFP®, CMT (@AdamKoos) May 17, 2019
$XLK vs. $SPY Technology vs. S&P 500 …OK. it could be worse. Still holding up for now. pic.twitter.com/n4k2sIGHXd
— Ian McMillan, CMT (@the_chart_life) May 17, 2019
The most important chart in the world – the Fed Broad Trade Weighted Dollar Index – the data (for me) comes out a week late. The next release will have its nose pressed against the ceiling of 130. A break, and we are probably into the next and most destructive phase of $ rally. pic.twitter.com/0zwjsWNzz7
— Raoul Pal (@RaoulGMI) May 16, 2019
Tesla at its lowest level since Dec 2016, down 42% since funding was secured. $TSLA pic.twitter.com/xQijh5HelZ
— Charlie Bilello (@charliebilello) May 17, 2019
$TSLA holders on Robin Hood made a new high yesterday while the stock is making new multi year lows. A couple things: 1. That's a lot of supply that could hit Tesla lower. 2. The "free" trading aspect is terrible incentive for in-experienced investors with no risk management pic.twitter.com/XcfdGCRn1y
— Thomas Thornton (@TommyThornton) May 17, 2019
At a coffee shop can't help but overhear a mortgage salesman botch up technical analysis on interest rates. That guy needs a CMT The client bought it @CMTAssociation
— Louis Llanes (@louisllanes) May 17, 2019