Sponsored By:

Today’s Summary
Monday, April 22nd, 2019
Indices: US stocks were a mixed bag in today’s session. The Dow Jones Industrial Average fell 48 points or 0.18%, while the S&P 500 finished up 0.10%. The Nasdaq was the strongest of the major indices, gaining 0.22% to close at a fresh all-time high.
Sectors: Energy led, gaining 2.02%. Real Estate lagged falling 1.07%.
Commodities: WTI Crude Oil futures jumped 2.70% to settle at a new YTD high of $65.70. Gold Futures were unchanged and continue to trade around $1,277 per ounce.
Currencies: The US Dollar Index was lower by 0.18%.
Interest Rates: The US 10-year Treasury yield moved higher to 2.585%.
Here are some of the best charts, articles, and ideas being shared on the web today!
Chart of the Day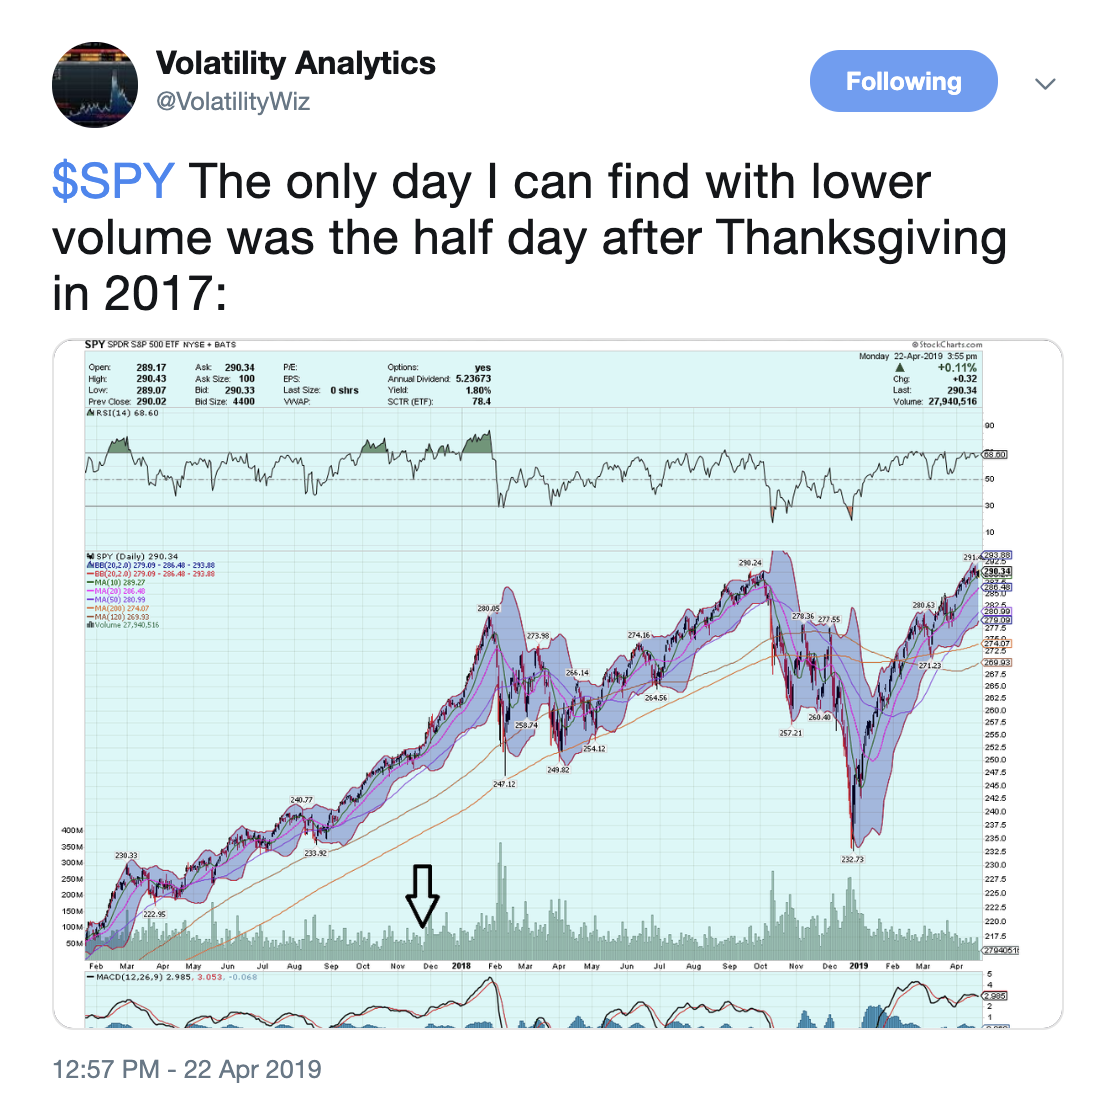
Today’s chart of the day was shared on Twitter by Volatility Analytics (@VolatilityWiz). It’s a chart of the S&P 500 index highlighting the unusually low volume seen in today’s session. The last time volume was this low was the half-day after Thanksgiving of 2017. This is notable because today was a full trading day and there have been several shortened sessions since Thanksgiving of 2017. All of which, saw higher participation between buyers and sellers than we saw today. This lack of activity speaks to the low-volatility environment we’re currently in as volume and volatility often go hand-in-hand.
Quote of The Day
“The demand for certainty is one which is natural to man, but is nevertheless an intellectual vice.”
– Bertrand Russell (British Philosopher)
Financials Showing Potential – The Chart Report
In this report, we focus on the Financial sector and what some of the smartest technical analysts are saying about it right now.
Opportunity in Copper – Real Vision
In this video, Joe Perry, of ForexAnalytix sits down with RealVision to discuss a potential breakout in Copper.
Weekly S&P 500 Chart Storm – TopDown Charts
Callum Thomas highlights the 10 charts and themes that he thinks are important to pay attention to right now.
Next Bump in Pre-Election Year Rally Could Arise in May – Jeff Hirsch
Seasonality expert, Jeff Hirsch has been vocal about pre-election years (like 2019) being one of the strongest years for the stock market in the presidential cycle. In this short post, he explains why May could be the start of another leg higher for stocks.
Rare Shift in Stock/Bond Ratio – Chris Ciovacco
In this post, Chris Ciovacco takes a look at the Commodity Channel Index or CCI. He points out the extreme reading it made recently and what it suggests for the market going forward.
Top 10 Tweets
Continue to feel good about our overweight large caps (S&P 500), underweight small caps (Russell 2000) … see relative performance since last September’s S&P 500 high pic.twitter.com/yz17SR1kCy
— Liz Ann Sonders (@LizAnnSonders) April 22, 2019
NASDAQ 100's weekly RSI now exceesd 66.
In the past, the return of strong momentum was mostly a positive sign for the stock market pic.twitter.com/SuKVdDBct9
— Troy Bombardia (@bullmarketsco) April 22, 2019
$XLV has an RSI under 30 and is ~5% below its 20 DMA. pic.twitter.com/sh4z42W9kS
— Dan Russo, CMT (@DanRusso_CMT) April 22, 2019
This is one of the biggest one-day ETF flows I've ever seen – a $1.5 billion inflow to BlackRock's 20+ year Treasury ETF, $TLT. pic.twitter.com/xGmy0bbKbw
— Lisa Abramowicz (@lisaabramowicz1) April 22, 2019
RBOB Gasoline futures looking for highest settle since July 2018 $UGA $RB_F $GASO pic.twitter.com/DTimecUB01
— Mike Zaccardi, CFA, CMT (@MikeZaccardi) April 22, 2019
Bears get sleepy after April OpEx apparently. pic.twitter.com/vLWLBdrjTa
— OddStats (@OddStats) April 21, 2019
As Utilities flirt with a failed breakout, what might this mean for other areas of the market – specifically yields?
Over the past 8-yrs $XLU has had a strong inverse correlation w/ $TNX as major tops and bottoms have occurred simultaneously and confirmed one another.. what now? pic.twitter.com/YwcN0LFe8O
— Steven Strazza (@sstrazza) April 22, 2019
If gold falls below 1200, it's pretty much lights out on gold bugs.$GC_F $GLD $GDX pic.twitter.com/yp8REwM4OL
— Dow (@mark_dow) April 22, 2019
$OSTK and #bitcoin $btc $xbt are diverging for basically the first time in two years. Past 90 days: $OSTK down 18% vs $btc up 54% pic.twitter.com/NiOpShdCfH
— Oliver Renick (@OJRenick) April 22, 2019
$VIX pic.twitter.com/ugz9YyZBXJ
— Andrew Thrasher, CMT (@AndrewThrasher) April 22, 2019