Sponsored By:

Today’s Summary
Wednesday, April 24th, 2019
Indices: US stocks were lower in today’s session with the Dow Jones Industrial average falling 59 points or 0.22%. The S&P 500 and Nasdaq also fell around 0.22%, while the Russell 2000 managed to close higher by 0.19%.
Sectors: Real Estate led, gaining 0.76%. Energy lagged, falling 1.75%.
Commodities: WTI Crude Oil futures fell 0.81% to $65.76. Gold Futures gained 0.35% and are trading around $1,278 per ounce.
Currencies: The US Dollar Index was higher by 0.44%.
Interest Rates: The US 10-year Treasury yield slipped to 2.522%.
Here are some of the best charts, articles, and ideas being shared on the web today!
Chart of the Day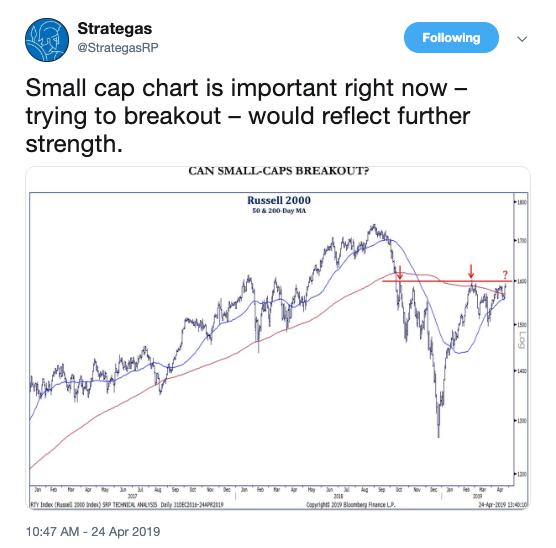
Today’s chart of the day was shared on Twitter by Strategas Research Partners (@StrategasRP). It’s a chart of the small-cap Russell 2000 index with the 50-day moving average in blue and the 200-day moving average in red. Strategas calls to attention the key resistance level that small-caps are testing right now. Traders and analysts watch the Russell 2000 as a gauge for risk appetite as small-caps tend to be riskier than their larger-cap peers. It has been concerning to some that both the S&P and Nasdaq have returned to all-time highs while the Russell seems to be stalling out around the 200-day moving average. It would send a bullish message to the broader market if the Russell is able to breakout out of this resistance level.
Quote of The Day
“It ain’t what you don’t know that gets you into trouble. It’s what you know for certain that just ain’t true “
– Mark Twain (American Writer)
Dollar Perking Up – The Chart Report
The US Dollar has been getting a lot of attention lately as it tests a key resistance level. This piece from The Chart Report covers what some of the top-technicians are saying about it right now.
Why are Stories so Important to Investors? – Behavioural Investment
Here’s an interesting read that focuses on the tendency for market participants to need a narrative to base their investment decisions on. The article highlights some of the dangers of searching for a story to fit your investment thesis.
Nasdaq New High A Little Thin? – Dana Lyons
In this link, Dana Lyons discusses the new all-time highs on the Nasdaq and points out a potential red-flag that’s keeping him from embracing this breakout.
End of the Best Six Months. ShouldYou Sell in May? – Jeff Hirsch
Seasonality expert, Jeff Hirsch weighs in on the well-known investment strategy, “Sell in May and go away”.
Russell 3000 Advance/Decline Line Bullish for Broader Market – John Kolovos – Bloomberg
Technical Analyst, John Kolovos joined host Abigail Doolittle on Bloomberg earlier today to take a look at the Russell 3000 and what it’s signaling for the broader market.
Top 10 Tweets
With nasdaq at all time highs and the $spx a pebble away. The $iwm is interesting as it reclaimed $156.30 and if it can get and stay above $158.20. It will brush the left over Bears back. pic.twitter.com/yWZMc1ca3p
— Scott Redler (@RedDogT3) April 24, 2019
hmmmmmm…… $DXY #USDollar pic.twitter.com/6MQgMhKKXc
— Callum Thomas (@Callum_Thomas) April 24, 2019
US stocks nearing ATHs vs non-US stocks. 1yr total returns:$VTI +12.5%$VXUS -3.6%$UUP +11.2% pic.twitter.com/K7btRgKvsV
— Mike Zaccardi, CFA, CMT (@MikeZaccardi) April 24, 2019
As a percentage of total issues, $NDX is leading the new high list with 14 (14%). $SPX is second with 47 (9.4%). Small-caps are still dragging their feet, but there was a nice uptick yesterday (21 new highs in $SML). pic.twitter.com/DyjQ5tzdio
— Arthur Hill, CMT (@ArthurHill) April 24, 2019
"Sell in May and go away" didn't work all that well last year in U.S. stocks. This year may revert to form, if a colleague's chart is any guide. pic.twitter.com/TMi0LKa5a1
— Bloomberg Radio's Dave Wilson (@TheOneDave) April 24, 2019
II data this week showed a slight downtick in both bulls and bears. Bull-bear spread remains elevated but shy of the 2018 peaks. #Sentiment composites published by @NDR_Research suggest sentiment overall has moved back into the excessive optimism zone. pic.twitter.com/o9GF6mA83V
— Willie Delwiche (@WillieDelwiche) April 24, 2019
The trade-weighted $DXY Dollar Index is still clinging onto resistance, but an equally-weighted USD measure is pushing through its ceiling: pic.twitter.com/80NUQc26v9
— John Kicklighter (@JohnKicklighter) April 24, 2019
Ratio of General Motors to Tesla at its highest level in over 2 years.$GM $TSLA pic.twitter.com/yeFdb4Panj
— Charlie Bilello (@charliebilello) April 24, 2019
$TLT off to the races. pic.twitter.com/9O9OYfR0oF
— Ryan Deitrich (@ryandeitrich) April 24, 2019
Ship of fools $BTC pic.twitter.com/1GMAQZJ9Eo
— Michael Kahn, CMT (@mnkahn) April 24, 2019