Sponsored By:

Today’s Summary
Thursday, April 25th, 2019
Indices: US stocks were mixed in today’s session with the Dow Jones Industrial Average closing down 135 points or 0.51%. On the other hand, the Nasdaq gained 0.21% to close at a fresh all-time high.
Stocks: Shares of 3M ($MMM) had their worst single-day decline since the 1987 stock market crash. The stock fell nearly 13% after announcing Q1 earnings results.
Sectors: Communications led, gaining 1.12%. Industrials lagged, falling 2.01%.
Commodities: WTI Crude Oil futures fell 1.21% to $65.09. Gold Futures were unchanged and continue to trade around $1,278 per ounce.
Currencies: The US Dollar Index was unchanged.
Interest Rates: The US 10-year Treasury yield moved higher to 2.534%.
Here are some of the best charts, articles, and ideas being shared on the web today!
Chart of the Day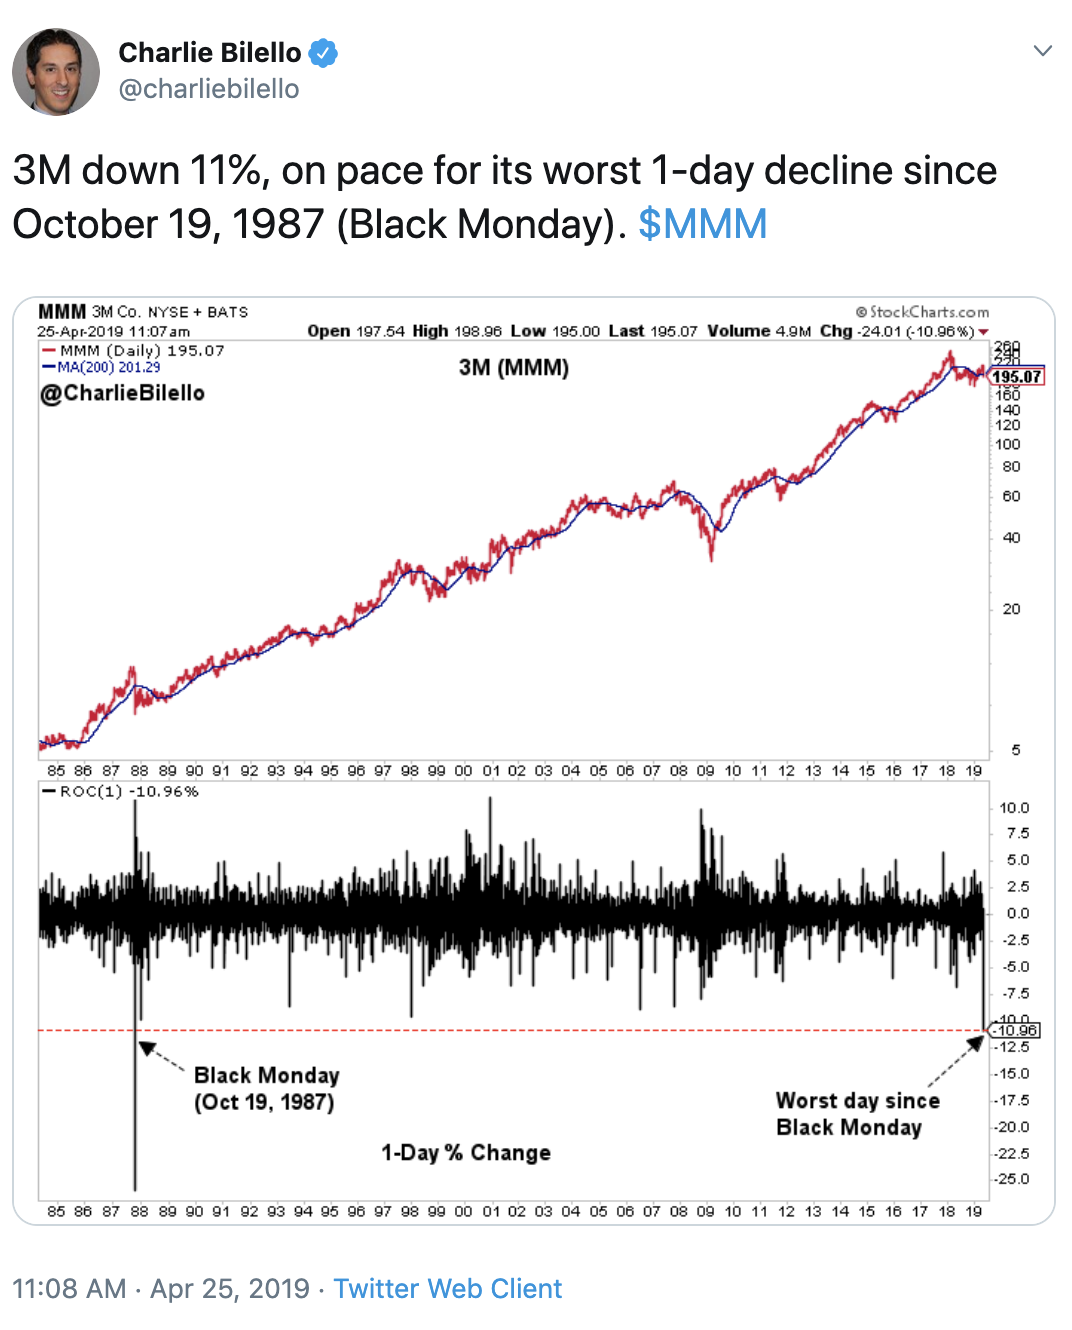
Today’s chart of the day was shared on Twitter by Charlie Bilello (@CharlieBilello). It’s a chart of 3M ($MMM) going all the way back to the mid-1980s. Charlie highlights the fact that today, shares of 3M saw their worst one-day percentage decline since the infamous stock market crash in 1987 known as Black Monday. The stock closed down 12.95% today, after announcing Q1 earnings. 3M is the 3rd largest component in the Dow Jones Industrial Average. As a result, the Dow was down 135 points today while the Nasdaq closed at all-time highs and the S&P closed flat.
Quote of The Day
“The stock market is never obvious. It is designed to fool most of the people, most of the time. “
– Jesse Livermore (American Investor)
Is a Volatility Tsunami Imminent? – The Reformed Broker
Volatility has been collapsing lately and many expect it to pick up again soon. Volatility expert, Andrew Thrasher wrote this guest post on Josh Brown’s blog addressing whether or not a spike in volatility is looming on the horizon.
Dollar Breakout – Greg Harmon
The US Dollar broke out to a nearly 2-year high yesterday after moving sideways in a tight range for months. In this post, Greg Harmon explains why the chart is suggesting further upside.
We’re Baaaack! – All Star Charts
In this post, JC Parets takes a look at the major US indices now that they’ve returned to levels that they had previously failed at.
Neutral Sentiment Hits Multi-Year High – Bespoke
In this note, Bespoke takes a look at the AAII’s weekly sentiment survey. They found that neutral sentiment is surging which suggests investors have little conviction on the direction of the market right now.
Gold Bulls Don’t Want to See Australian Dollar (AUDUSD) Break-Down – Chris Kimble
Technician, Chris Kimble points out that Metals and the Aussie Dollar are strongly correlated to each other. He warns Gold bulls that the Aussie Dollar is about to break an important support level.
Top 10 Tweets
$SPY $SPX Is sell in May and Go away really a thing? Here are the stats over the last 19 Mays and how monthly price action has done 3 months and one year later. @johnscharts #study #stats #statistics pic.twitter.com/SIqR7isoEu
— TrendSpider (@TrendSpider) April 25, 2019
"History doesn't repeat, but it rhymes."
In 2016, breadth broke out ahead of price, yet many doubted the durability of the rally.
In 2019, breadth broke out ahead of price, yet many doubted the durability of the rally.
"Those who do not learn history are doomed to repeat it." pic.twitter.com/aGoFZJTaEi
— Ryan Detrick, CMT (@RyanDetrick) April 25, 2019
Tracking the levels the market reacts to is a key component of technical analysis. If that' a 50-period MA on a 1 hour chart, then that's what I'll watch. When it begins responding to a diff. level on a repeated basis, then so will my analysis. https://t.co/OYO1lOBIyt
— Andrew Thrasher, CMT (@AndrewThrasher) April 25, 2019
6. The largest reaction so far this year has barely been more than 2%. Going back 40 years, no year has seen a lower drawdown and all but two (95%) have seen a drawdown of at least 5%. A meatier reaction ahead is odds-on. Just a heads up pic.twitter.com/qfLrVXHadF
— Urban Carmel (@ukarlewitz) April 25, 2019
Here is how some worldwide equity markets are looking YTD (source: Koyfin) pic.twitter.com/lROi6lkYy3
— Jimmy Erdmier, CMT (@JimmyErdmier) April 25, 2019
Junk-bond yields have fallen below rates on leveraged loans, the first time that's happened for a prolonged stretch since 2007. https://t.co/ey09CDDzvD pic.twitter.com/hmeFNbgBqm
— Lisa Abramowicz (@lisaabramowicz1) April 25, 2019
Here's the chart of the Shanghai Composite I sent to Institutional clients last week, noting that this is a very logical place for it to consolidate its recent gains.
Seeing a lot of charts like this where I'm bullish structurally, but tactically not a place to be aggressive. pic.twitter.com/77Lm5Wf8j2
— Tom Bruni, CMT (@BruniCharting) April 25, 2019
The $TSLA chart is something to behold. It's at session lows at $2 away from breaking the 2018 low of $244.59. pic.twitter.com/YBQxxHCeTU
— ForexLive (@ForexLive) April 25, 2019
This is an interesting position for the Dollar to be in – just above an important bullish breakout – before the 1Q US GDP figures come in… pic.twitter.com/pmunckfW4K
— John Kicklighter (@JohnKicklighter) April 25, 2019
Crazy state of the day courtesy of @TheOneDave. $MMM is having its biggest one day plunge since the 1987 stock market crash https://t.co/T6gGEHlQIv pic.twitter.com/UZL1xYdixH
— Joe Weisenthal (@TheStalwart) April 25, 2019