Sponsored By:

Today’s Summary
Tuesday, April 30th, 2019
Indices: US stocks were mixed in today’s session with the Dow Jones Industrial Average closing up 39 points or 0.15%. The S&P closed up 0.10% while the Nasdaq and Russell 2000 fell 0.66% and 0.45% respectively.
Stocks: Google’s parent company, Alphabet inc. ($GOOG) had its worst day in nearly 7 years, falling 7.50% after the release of their Q1 earnings report.
Sectors: Utilities led, gaining 1.64%. Communications lagged, falling 2.23%.
Commodities: WTI Crude Oil futures rose 0.58% to settle at $63.84. Gold Futures were higher by 0.33% and settled around $1,286 per ounce.
Currencies: The US Dollar Index fell 0.35%.
Interest Rates: The US 10-year Treasury yield fell to 2.504%.
Here are some of the best charts, articles, and ideas being shared on the web today!
Chart of the Day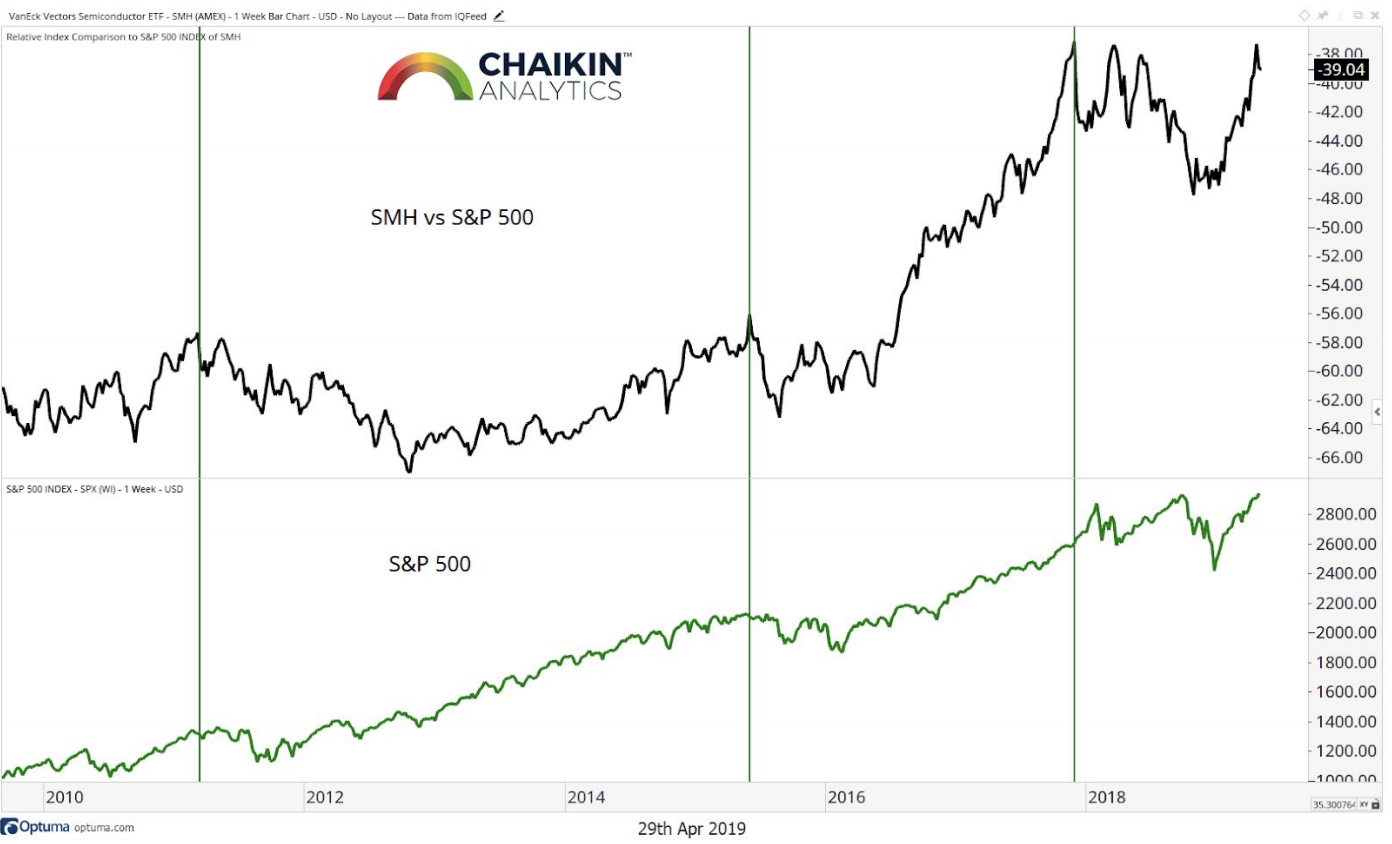
Today’s chart of the day was shared in Chaikin Analytics’ morning note, written by Chief Strategist, Dan Russo (@DanRusso_CMT). It’s a ratio chart showing the performance of Semiconductors ($SMH) relative to the S&P 500. In the note, Russo explains that this ratio tends to act as a leading indicator for the broader market. He adds that Semis have come under pressure lately following Intel’s ($INTC) earnings report. While he maintains a bullish view of the overall market, Russo cautions that a potential breakdown in Semiconductors on a relative basis would alter his thesis. Therefore, it would be wise to keep a close eye on this relationship.
Quote of The Day
“Be sensitive to the subtle differences between ‘intuition’ and ‘into wishin’.”
– Ed Seykota (Systematic Trader)
What’s In-Store for Small-Caps? – The Chart Report
The Russell 2000 index has been getting a lot of attention lately. In this report, we take a look at what smartest technicians are saying about the outlook for small-cap stocks.
Oil Prices are Headed Lower Between Now and September – Mark Newton – Bloomberg
In this clip, Mark Newton joins host Abigail Doolittle on Bloomberg to discuss Crude Oil. He points out that price broke a key trendline and warns that we’re heading into a seasonally weak time of year for Crude Oil.
Breaking the Banks – Dragonfly Capital
Here’s a short note from Greg Harmon outlining a potential breakout that he’s seeing from the Bank ETF, $KBE.
S&P 500 & Nasdaq up 76.2% of the Time on May’s First Trading Day
Tomorrow is the first trading day for the month of May. Jeff Hirsch explains that the first trading day in May tends to be bullish despite the old adage “Sell in May and go away.”
Twitter Could Surge 20% Back to Multi-Year Highs – Todd Gordon – CNBC
Technical Analyst, Todd Gordon thinks Twitter is offering a good risk/reward opportunity right now. He explains how to express the trade using options.
Top 10 Tweets
The performance spread of US cap tiers is noteworthy here- you're either large cap or you're struggling on a relative basis! $SPX $SPY $MDY $MID $SML $IWM $IJR $IWC pic.twitter.com/VWJJfnSuEA
— David Keller, CMT (@DKellerCMT) April 30, 2019
Here's the chart that bothers me the most right now. NDR Daily Trading Sentiment is not only in Excessive Optimism but its approaching its highs from Summer of 2018. Yikes@hmeisler wrote sentiment earlier this week too… pic.twitter.com/S9Z83mhzYI
— Michael Antonelli (@BullandBaird) April 30, 2019
If $GOOGL makes a higher low here it becomes an interesting risk/reward play for some sort of throwback the next couple of days. Stop would be under daily low. pic.twitter.com/ZOBIw3fB59
— Andrew Adams CFA, CMT (@DayTraderGator) April 30, 2019
#CRUDE oil's breakdown over last week has taken a toll on momentum and most energy stocks are showing pretty severe breakdowns – See patterns on OIH violating trendline support- Oil Volatlity has turned up as well in recent days on this break $CL_F pic.twitter.com/LRJXrdzL7t
— Mark Newton (@MarkNewtonCMT) April 30, 2019
With higher highs in the US Dollar Index this past week, Emerging Markets did NOT make new relative lows $DXY $EEM $SPX $SPY $UUP pic.twitter.com/jjRMWUXhEN
— J.C. Parets (@allstarcharts) April 30, 2019
The Dollar has dropped via the $DXY and EURUSD moving back above 1.1200. Yet beware intent with Fed ahead. Here's an equal weighted index: pic.twitter.com/2BVOlaP5tT
— John Kicklighter (@JohnKicklighter) April 30, 2019
Since 1998, when $VIX has been under 25 correlation to the S&P 500 has only been at this level six previous times. pic.twitter.com/vRLhKlpu5H
— Andrew Thrasher, CMT (@AndrewThrasher) April 30, 2019
$VIX is rising along with the S&P. Their 10 day correlation is now at +0.63
While this could be short term bearish, it's mostly bullish 6-12 months later. $SPX up 94% of the time 9 months later
[idea from @AndrewThrasher . He's a good volatility trader] pic.twitter.com/oWNSVoh4Z3
— Troy Bombardia (@bullmarketsco) April 30, 2019
$KBE S&P Bank ETF 1D: $46 resistance zone is key pic.twitter.com/myIdi8dRdX
— Shane C. Murphy (@murphycharts) April 30, 2019
VWAP from the IPO VWAP failure found supply again pic.twitter.com/cGMDlT5hk1
— Brian Shannon, CMT (@alphatrends) April 30, 2019