
Today’s Summary
Wednesday, March 6th, 2019
US stocks fell in today’s session, with the Dow Jones Industrial Average closing down 133 points or 0.52%. The small-cap Russell 2000 index was especially weak today, closing down 2.01%. The Dow Transportation Average booked its ninth consecutive loss, marking the longest losing streak for the index in several decades.
The Materials sector was the only S&P 500 sector to close positive today, with a gain of 0.22%. Healthcare was the weakest, closing down 1.46%.
Crude Oil slipped 34 cents to settle at $56.22 per barrel. Gold held steady and is trading at the same price it began the year at, around $1,287 per ounce.
Here are some of the best charts, articles, and ideas being shared on the web today!
Chart of the Day
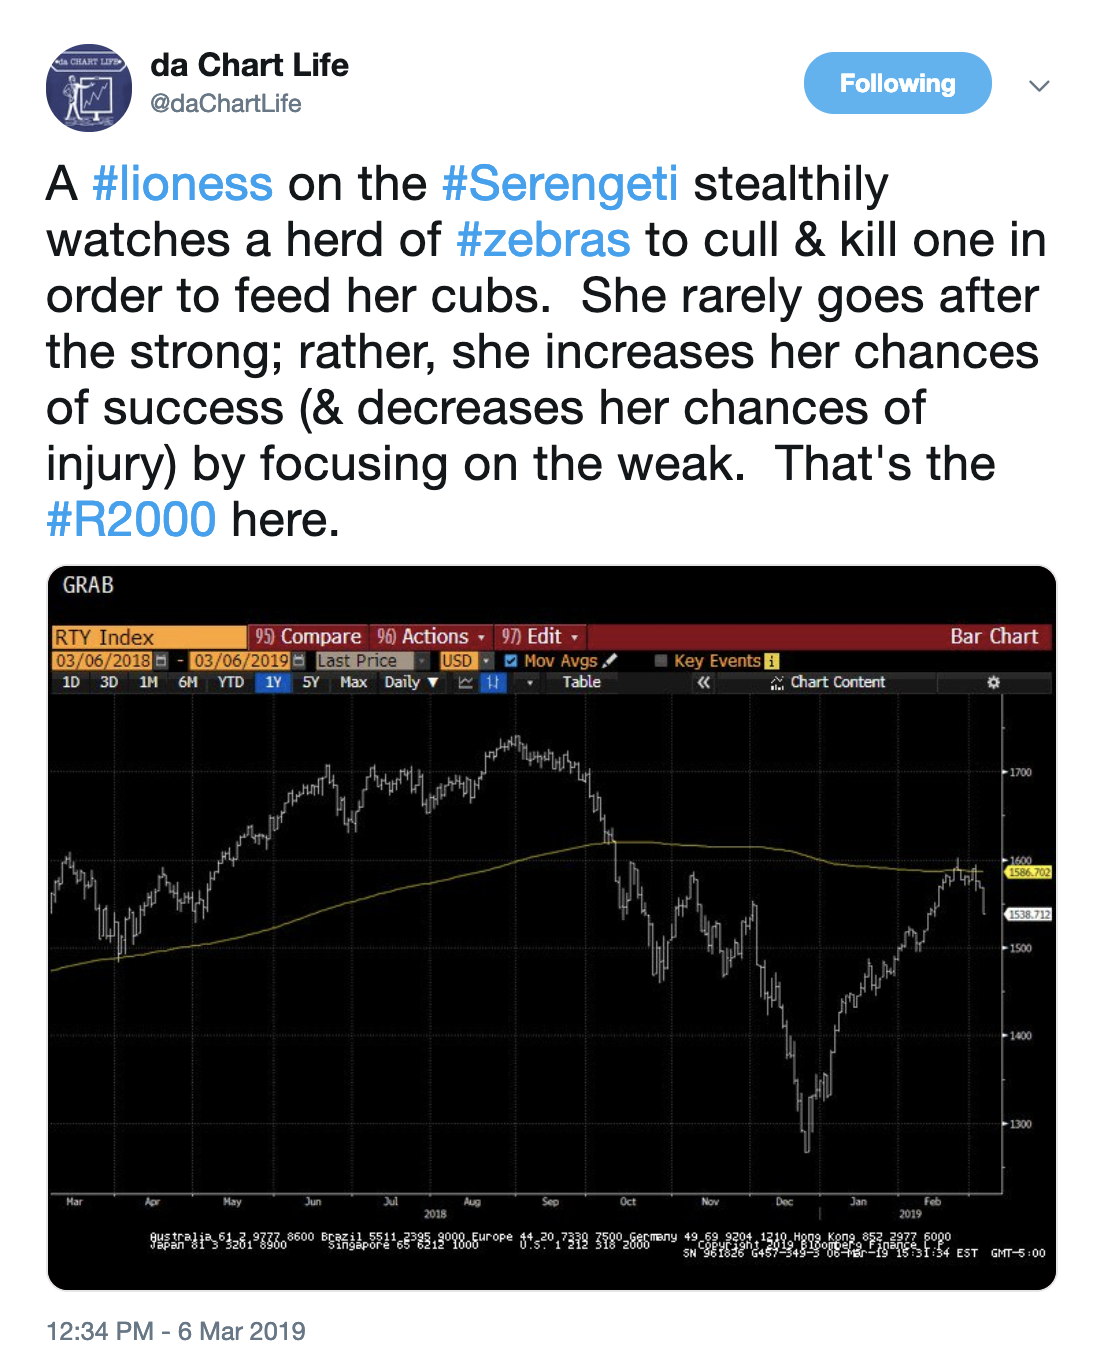
Today’s chart of the day was shared on Twitter by John Roque, (@daChartLife). It’s a daily bar chart of the small-cap Russell 2000 index. The Russell has been underperforming the other major US indices the past week, after having led the 2019 rally. He uses the metaphor of a female lion hunting zebras in order to feed her cubs. He explains that the lioness will stalk the weakest zebra for the best risk/reward outcome. In other words, if you’re looking for opportunities to short the market here, it’s best to go after the weakest indices like the Russell 2000 rather than its stronger peers like the S&P 500.
Quote of The Day
“Spend each day trying to be a little wiser than you were when you woke up”
-Charlie Munger, (American Investor)
Top Links
The Dow Jones Transportation Average has been on a rare losing streak, closing down 9 days in a row. We share insights from Frank Cappelleri of Instanet where he explains what this means for the broader market going forward.
The Problem with the Smart Money Flow Index – The Chart Report
There has been a lot of chatter lately about the Smart Money Flow Index as it seems to be rolling over. Many believe that this signals the ‘smart money’ is selling out ahead of the ‘dumb’ money. We explain how the indicator is calculated and why its name is deceiving.
FANG Still Alive But No Longer Leading the Pack – The Chart Report
This article takes a look at some of Investors favorite growth stocks. We discuss a recent interview on CNBC with Oppenheimer’s Ari Wald where he gives his thoughts on where the FANG stocks are headed.
Seasonal Crude Oil Rally up 80% of the Time Mid-February to Mid-May – Jeff Hirsch
In this short blog post, seasonality expert Jeff Hirsch points out the tendency for Crude Oil to perform well from mid-February until mid-March. He includes a table outlining how the commodity has historically performed during these months.
[Video] Stock Market Analysis March 6th, 2019 – Brian Shannon
Here’s a video from technical analyst, Brian Shannon (@AlphaTrends) He highlights the failed breakout in Biotech ($IBB) and the recent weakness from the Russell 2000 index.
Top 10 Tweets
$TRAN now down 9 straight… but it was a tad worse in 1967…
From 10/03/67 to 11/06/67, $TRAN fell 24/25 days, which included two 12 day losing streaks.
— Frank Cappelleri (@FrankCappelleri) March 6, 2019
Interesting that the Dow Jones Internet Index didn't get overbought despite a nearly 30% rally off its December lows.
Not the only chart I'm seeing like this.
— Tom Bruni (@BruniCharting) March 6, 2019
Was kinda surprised to see the China A Share ETF is outperforming S&P 500 over past five years,.. pic.twitter.com/1l9ahqipkT
— Eric Balchunas (@EricBalchunas) March 6, 2019
$IWM Russell 2000 …Rejected at resistance. Now out of the box and down. Has some time to recover. pic.twitter.com/ZmwBOA9872
— Ian McMillan (@the_chart_life) March 6, 2019
10 years ago this month (March 2009) the S&P 500 was at its bottom. Since then it is up over 400% (5x).
Don't forget that the future is brightest when it looks the bleakest. pic.twitter.com/bZlQOCQ6SZ
— Nick Maggiulli (@dollarsanddata) March 6, 2019
With the exception of Qatar, every country ETF is positive in 2019 w/ an average return of +10%. Best start to a year since 1987. pic.twitter.com/gyuc8m1KBl
— Charlie Bilello (@charliebilello) March 6, 2019
$BA pretty extended on the 4hr pic.twitter.com/YDo2vHnKDI
— BostonCharts (@bostonchaahhts) March 6, 2019
NYSE volume that was tilted 6 to 1 to the downside helped fuel a spike in $TRIN to above 2.0 for the first time since December. pic.twitter.com/qe4bNMWPMz
— Willie Delwiche (@WillieDelwiche) March 6, 2019
Those watching the TRIN today would do well to take GE into account.
— John Bollinger (@bbands) March 6, 2019
While #Bitcoin $XBTUSD has been basing, its been #LITECOIN $XLCUSD that actually has outperformed lately & made a very sharp move higher: This week stands to close at the highest levels since early October 18- ( I own) pic.twitter.com/aG75hdmqXt
— Mark Newton (@MarkNewtonCMT) March 7, 2019