
Today’s Summary
Friday, March 8th, 2019
Indices: US stocks fell for the fifth day in a row today, marking the worst week for stocks so far this year. The Dow Jones Industrial Average spent a majority of the session down triple digits but was able to rally into the close to finish the day down only 23 points or 0.09%. The Dow Transportation Index extended its losing streak to 11-days.
Sectors: The Utility sector led for the second day in a row today with a gain of 0.35%, while the Energy sector was the weakest, down 1.87%.
Commodities: Crude Oil futures fell 66 cents or 1.2% to settle at $56.00 per barrel. Gold futures rose about 1% to close at $1,299 per ounce.
Currencies: The US Dollar Index fell 0.32%.
Here are some of the best charts, articles, and ideas being shared on the web today!
Chart of the Day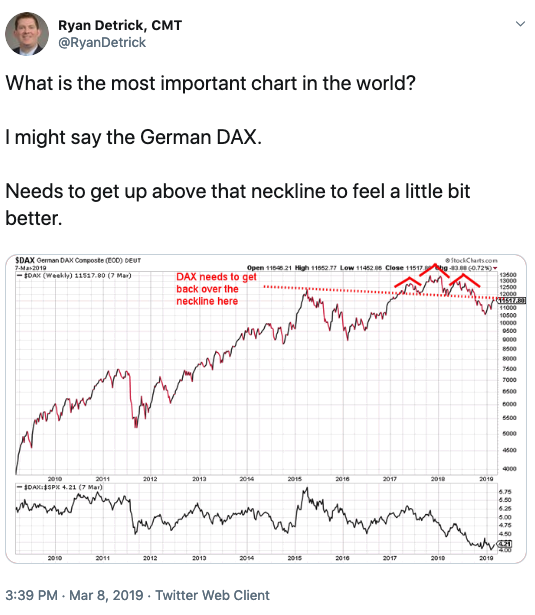
Today’s chart of the day was shared on Twitter by Ryan Detrick (@RyanDetrick), Senior Market Strategist at LPL Financial. It’s a line chart of the German DAX. The Dax is essentially Germany’s version of the Dow, consisting of the 30 largest blue-chip stocks traded on the Frankfurt Stock Exchange. Detrick calls this the most important chart in the world right now because it formed a bearish head & shoulders top and has already broken below the ‘neckline’ of the pattern. Further weakness from the German Dax would likely affect other foreign equity markets, including the United States.
Quote of The Day
“All men make mistakes, but a good man yields when he knows his course is wrong, and repairs the evil. The only crime is pride”
– Antigone 441b.c., Sophocles (Ancient Greek Playwright)
Top Links
Cryptocurrencies are still trying to recover from the bloodbath they experienced in 2018. In this article, we highlight the recent strength in Litecoin ($LTC) and feature some respected technicians who think it’s heading higher.
In this blog post, Greg Schnell breaks down several charts of the US Dollar Index. He explains the impact a stronger or weaker Dollar can have on other asset classes and urges readers to keep an eye on it.
[Podcast] Chart Summit 2019 Review with JC & Sean – All Star Charts
A few weeks ago, some of the best technicians got together in the small ski-town of Breckenridge, Colorado for the 2019 Chart Summit. This podcast highlights some of the best moment and presentations from the conference.
Stock Rollover Could Be Starting, Says Joe Friday – Chris Kimble
Here’s a short read from Chris Kimble where he argues that stocks could accelerate to the downside. He points out momentum indicators have already rolled over and are pointing lower.
[Video] Here’s How Financials Shape Up 10 Years After the Financial Crisis – Frank Cappelleri – CNBC
Technical Analyst, Frank Cappelleri made an appearance on CNBC yesterday to check-up on the Financial sector 10-years after the Great Financial Crisis. Frank breaks down the technicals of one bank stock, in particular, Morgan Stanley ($MS).
Top 10 Tweet
The market's current weakness continues and is now breaking below important moving averages (support levels) – be attentive and wait until the market goes into oversold territory and stabilizes again before buying aggressively.
— Ralph Acampora CMT (@Ralph_Acampora) March 8, 2019
$SPX Ninth time in a row that the 200-day average didn't act as support or resistance. In other words, we're in a choppy market when moving averages mean squat. pic.twitter.com/8p8nGtROgo
— Mark Arbeter, CMT (@MarkArbeter) March 8, 2019
C'mon guys. Let's give it up for measured moves.
S&P 500 cash intraday.
Price is not random.$SPX $SPY $ES_F pic.twitter.com/wxJvLm2i58— David Zarling (@360research) March 8, 2019
FAANG stocks get rejected at the 200 DMA. $FB $AAPL $AMZN $NFLX $GOOGL pic.twitter.com/PDoyEby83i
— Dan Russo, CMT (@DanRusso_CMT) March 8, 2019
Holy smokes! Dow Transports $TRAN down for 11th day in a row, longest losing streak since 1972. Proved to be a #bearish tell back then pic.twitter.com/fA3hypkxoI
— Abigail Doolittle (@TheChartress) March 8, 2019
This 135-year-old stock index just logged its longest skid in about 50 years pic.twitter.com/vOBZGoNbhv
— BuySideTrade (@BuySideTrade) March 8, 2019
Update on chart I posted a few days ago. The "jaws" may be starting to close. $SPX $SPY $VIX $VXXB $TVIX pic.twitter.com/liATlxiCS4
— Andrew Adams CFA, CMT (@DayTraderGator) March 8, 2019
2/ This did a good job of indicating the top. Hoping will work the other way, too. Not there yet. pic.twitter.com/ndL0fpRUou
— Walter Deemer (@WalterDeemer) March 8, 2019
Euro at a 20-month low vs. US Dollar. Weakness in European financials still a concern. $EURUSD $EUFN pic.twitter.com/szMuZfcC1i
— Charlie Bilello (@charliebilello) March 8, 2019
Junk bonds send fresh negative message to stocks if they start turning lower again at the top of these falling channels $JNK $HYG $SPY pic.twitter.com/0wnrL2QSZS
— Chris Kimble (@KimbleCharting) March 8, 2019