Sponsored By:

Today’s Summary
Tuesday, April 9th, 2019
Indices: US stocks were lower in today’s session with the Dow Jones Industrial Average closing down 190 points or 0.72%. The Russell 2000 was the weakest among the major indices, falling 1.22%.
Sectors: Communications led with a gain of 0.27%. Industrials lagged, falling 1.36%.
Commodities: WTI Crude Oil futures fell 0.22% to settle at $63.98 per barrel. Gold futures were higher by 0.48% to settle at $1,308 per ounce.
Currencies: The US Dollar Index was more or less unchanged, slipping just 0.03%.
Interest Rates: The US 10-year Treasury yield fell to 2.502%.
Here are some of the best charts, articles, and ideas being shared on the web today!
Chart of the Day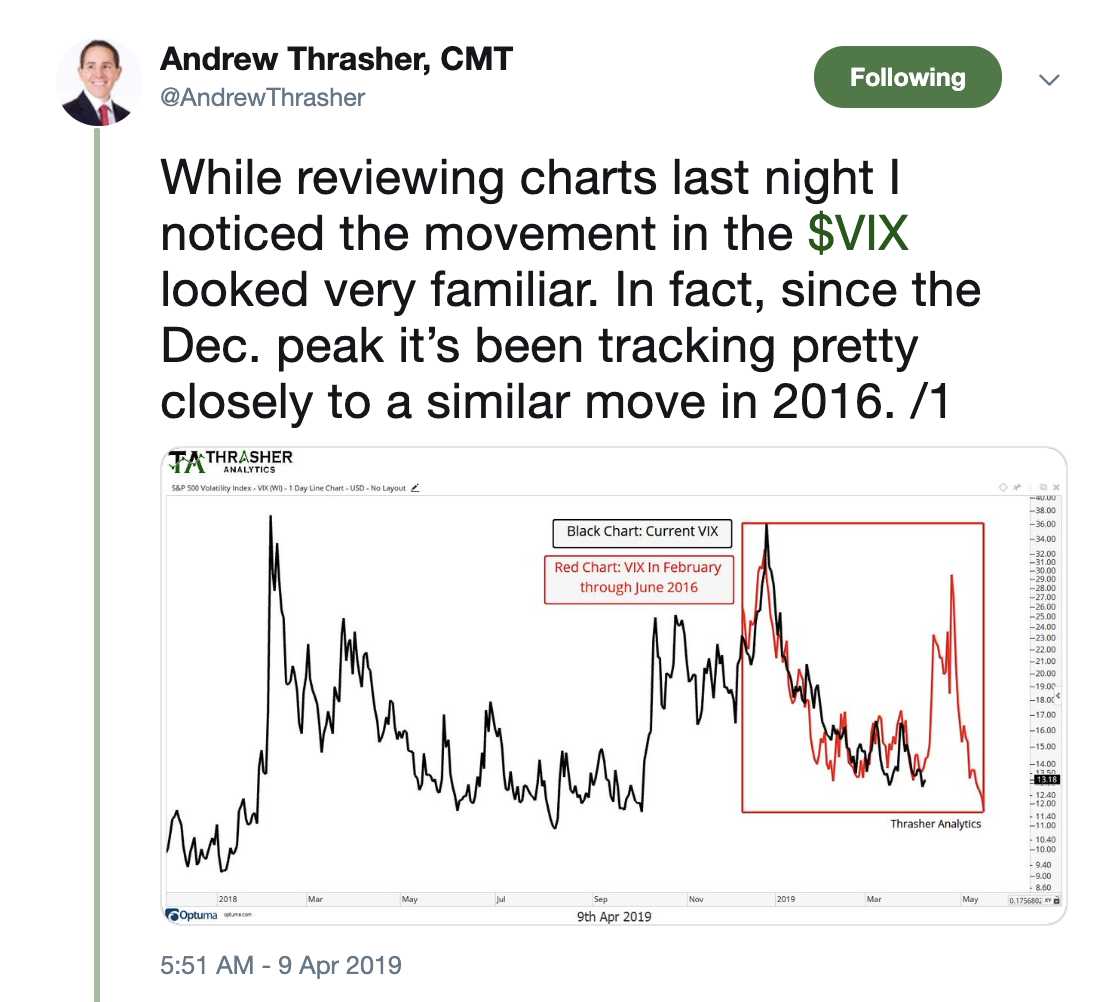
Today’s chart of the day was shared by Andrew Thrasher on Twitter (@AndrewThrasher). It’s an analog chart of the Volatility index in black, with the index’s price action from 2016 overlayed in red. As you can see the two have been moving very similarly. The chart begs the question; If history is any guide, will we get another big spike in volatility like the one we saw mid-way through 2016? Andrew admits that he’s not the biggest fan of single-period analog charts like this one but thinks the similarities between the two are hard to ignore. It’ll be interesting to revisit this comparison in a few months to see how closely 2019 tracks 2016.
Quote of The Day
“The secret to being successful from a trading perspective is to have an indefatigable and an undying and unquenchable thirst for information and knowledge.”
– Paul Tudor Jones II (American Investor)
The Best of the 2019 CMT Symposium – The Chart Report
Last week was the 49th Annual CMT Symposium in New York City. In this quick read, we highlight some of the best quotes and ideas from the event.
What Does Overhead Supply Even Mean? – All Star Charts
JC Parets breaks down the forces of supply and demand that make price move. He explains what it means when a chart has a level of “overhead supply” and gives examples of how to identify such levels.
Oil Into Prior Supply – Greg Harmon
In this blog post, Greg Harmon points out that Crude Oil has returned to a level of overhead supply which he expects will act as a speed bump, preventing further upside from here.
Doc Copper & Freeport Testing Breakout Levels! – Kimble Charting Solutions
Here’s a short read from Chris Kimble where he points out that Copper is testing a key breakout level. In addition, he shows that the mining company, Freeport-McMoRan ($FCX) is testing a similar level.
Overbought Means Up A Lot – David Keller – StockCharts.com
In this piece, David Keller explains that most people use RSI in an overly simplistic way. They buy when RSI gets oversold and sell when it gets overbought. David argues that the ability for RSI to become overbought is actually a bullish signal more often than not.
Top 10 Tweets
One thing I continue to monitor is the breadth of the $QQQ. Coming out of the 15/16 correction the % of stocks above their 200 dma quickly got above 50% and stayed there for over two years. Would like to see that happen sooner then later. pic.twitter.com/ibZgeF2He3
— Neil Blalock, CMT (@NeilBlalock) April 9, 2019
Here is the S&P500 and the question we're asking ourselves this week. Feel free to chime in $SPX $SPY pic.twitter.com/XqEGA3o4Es
— J.C. Parets (@allstarcharts) April 9, 2019
zzz…zzz…zzz
5 of the 8 lowest volume days of the year for SPY have been the last eight sessions.
(We're on track for 6 of 9) pic.twitter.com/LSLbihxU7E
— Luke Kawa (@LJKawa) April 9, 2019
The XLY/SPY ratio chart broke out and is now retesting. Would like to see it hold the lower end of the box on any pullback. $XLY $SPY pic.twitter.com/hylsp62hgt
— Matthew Timpane, CMT (@offbeatoperator) April 9, 2019
Crude Oil confirmed a break above 200-day MA and now above final Fibonacci retracement level. Head and shoulders bottom measures to 67.50 and the recent swing low at the 200-day line up as potential downside risk. $USO pic.twitter.com/XjEGkl6iid
— David Keller, CMT (@DKellerCMT) April 9, 2019
An inverted yield curve has preceded all recessions since 1959, but not all
inversions have been followed by recession (as in 1966 and 1998). The yield curve has inverted an average of 14 months ahead of recessions (see chart). pic.twitter.com/2juwERM0Io— Mark Minervini (@markminervini) April 9, 2019
Until $TSLA $TSLAQ chooses direction from this range, bulls/bears just fighting w/big swings technically. Fundamentally, Tesla still a mess pic.twitter.com/72ftu2an37
— Tarek I. Saab (@FibLines) April 9, 2019
Platinum trying$PPLT $PL_F pic.twitter.com/65lylFJ5P9
— David Zarling (@360research) April 8, 2019
Bitcoin futures volume is surging to a record on the CME thanks to the recent price jump. (And someone at the CBOE is probably kicking themselves) https://t.co/l0Ag8PFZ4z by @ericlamTO pic.twitter.com/V098k3D8XQ
— Tracy Alloway (@tracyalloway) April 9, 2019
I’m pretty dumb, someone tell me how these things typically resolve themselves…$DIS pic.twitter.com/r8xeBPB7y8
— Downtown Josh Brown (@ReformedBroker) April 9, 2019