Sponsored By:

Today’s Summary
Thursday, April 11th, 2019
Indices: US stocks were relatively unchanged in today’s session with the Dow Jones Industrial Average closing down just 14 points or 0.05%. The S&P 500 closed completely flat, while the Nasdaq fell by just 0.21%.
Sectors: Industrials led with a gain of 0.87%. Healthcare lagged, falling 1.23%.
Commodities: WTI Crude Oil futures fell 1.41% to settle at $63.70 per barrel. Gold futures were also lower by 1.41% to settle at $1,295.40 per ounce.
Currencies: The US Dollar Index was higher by 0.23%.
Interest Rates: The US 10-year Treasury yield rose to 2.499%.
Here are some of the best charts, articles, and ideas being shared on the web today!
Chart of the Day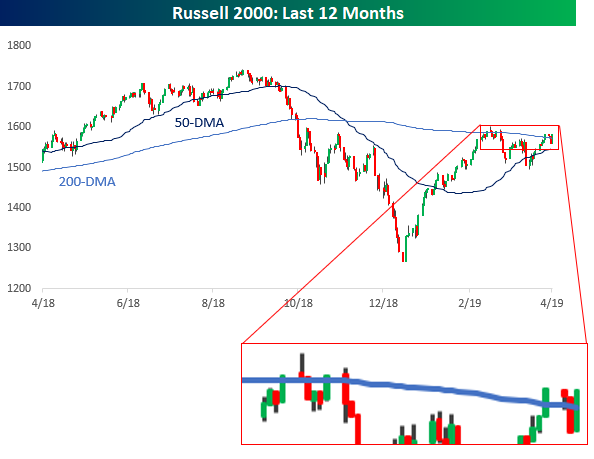
Today’s chart of the day was shared in a research note from Bespoke Investment Group. It’s a candlestick chart of the small-cap Russell 2000 index with the 50 and 200-day moving averages. Bespoke highlights the fact that the “Russell 2000 just can’t make up its mind” as it’s been wavering above and below the 200-day moving average for some time now, giving us no clear indication of a trend up or down. They note that yesterday’s close back above the 200-DMA marks the seventh time the index has crossed above or below its 200-DMA in the last 50 trading days. They add that two heavily weighted sectors within the index, Banks, and Biotech will need to move in order for the Russell to “make up its mind”.
Quote of The Day
“Be who you are and say what you feel, because those who mind don’t matter, and those who matter don’t mind.”
– Bernard M. Baruch (American Financier)
Why All The Pessimism? – The Chart Report
There’s a lot of negative sentiment among market participants right now. The financial media has given folks dozens of scary headlines to lose sleep over however, the charts are telling a different story.
All Star Charts Podcast with Eddy Elfenbein – Technical Analysis Radio
In this podcast, Eddy Elfenbein talks with JC Parets about how a fundamental guy like himself incorporates technical analysis into his process. He talks about his appreciation for Intermarket Analysis and Relative Strength.
Oppenheimer’s Wald Remains Bullish on Stocks But Small Cap Needs to Participate – Bloomberg
Oppenheimer’s head of technical analysis, Ari Wald joined host Abigail Doolittle on Bloomberg to discuss his market outlook. In the interview, he focuses on three charts; the S&P 500, the Russell 2000, and Amazon ($AMZN).
Journey to the Expert Level – David Keller
In this piece, David Keller eloquently draws comparisons between the process of learning an orchestral instrument and learning technical analysis. He explains that in both endeavors, you must start by mastering the basics before you’re able to bend the rules like an expert.
Is This Rally All JUNK? Examining the Short Term Bearish Case – BullMarkets.co
Here’s an interesting read from BullMarket.co that takes a look at the relationship between Junk Bonds ($JNK) and the overall stock market. The author puts forth several valid technical reasons to expect short-term weakness from stocks.
Top 10 Tweets
Price is the only real truth in trading, regardless of your style (value, growth, momentum, etc) we are all trend traders. We want to participate in the upward price activity (long) or down (short) It is how we get paid!
— Brian Shannon, CMT (@alphatrends) April 11, 2019
I see a lot of people worried about small caps. Don't get fooled by the $IWM flirting with the 200 day MA. It isn't lagging this year. It's up 18% YTD actually outpacing $SPY. pic.twitter.com/eoIe9lZtZ8
— Neil Blalock, CMT (@NeilBlalock) April 11, 2019
Nevertheless, still a LOT of underlying strength in the market… pic.twitter.com/XE0TaKr9M6
— Walter Deemer (@WalterDeemer) April 11, 2019
Global big boys did hit a new ATH this week…briefly. $SPY $IOO pic.twitter.com/z5iP4Unlak
— Andrew Adams CFA, CMT (@DayTraderGator) April 11, 2019
Gold prices ready for a melt down $GC_F $GLD pic.twitter.com/C1KapXsC7n
— Peter Brandt (@PeterLBrandt) April 11, 2019
A good way to assess whether value is poised to outperform growth is to look at the performance of tech stocks relative to financials. Right now, techs are firmly in control which means the run for growth should have some legs. $XLK $XLF pic.twitter.com/fgmPGJQqQu
— Michael A. Gayed, CFA (@pensionpartners) April 11, 2019
Still like oil after a wicked positive divergence in momentum. Price doesn't ALWAYS follow momentum, but this was one to pay attention to.$WTIC now trading > 70 on RSI(14) and has reclaimed its 200MA. Pullback would be completely normal. Still looking good.$OIL $USO $OILK pic.twitter.com/7vHvA3H5Wd
— Adam D. Koos, CFP®, CMT (@AdamKoos) April 11, 2019
Check out $JNK's 14 day RSI pic.twitter.com/sBigo6nZM6
— Troy Bombardia (@bullmarketsco) April 10, 2019
If you wanted to play the short side for a tactical trade, I get it.
Risk is well-defined and momentum is diverging, but objectively the bases many countries, stocks, sectors, have formed are extremely constructive and supportive of higher prices over the intermediate/long-term pic.twitter.com/trhicZOye2
— Tom Bruni, CMT (@BruniCharting) April 11, 2019
This stock could use a faceLYFT … $LYFT pic.twitter.com/RwFA4vWW2P
— Mike Larson (@RealMikeLarson) April 10, 2019