Sponsored By:

Today’s Summary
Tuesday, April 16th, 2019
Indices: US stocks closed higher with the Dow Jones Industrial Average gaining 68 points or 0.26%. The S&P 500 was flat, changing just 0.05%.
Sectors: Financials led, gaining 1.41%. Real Estate lagged for the second day in a row, falling 2.43%.
Commodities: WTI Crude Oil futures were higher by 1.21% to finish the day at $64.17 per barrel. Gold futures fell 1.1% to settle at a new YTD low of $1,277 per ounce.
Currencies: The US Dollar Index was slightly higher by 0.14%.
Interest Rates: The US 10-year Treasury yield moved higher to 2.589%.
Here are some of the best charts, articles, and ideas being shared on the web today!
Chart of the Day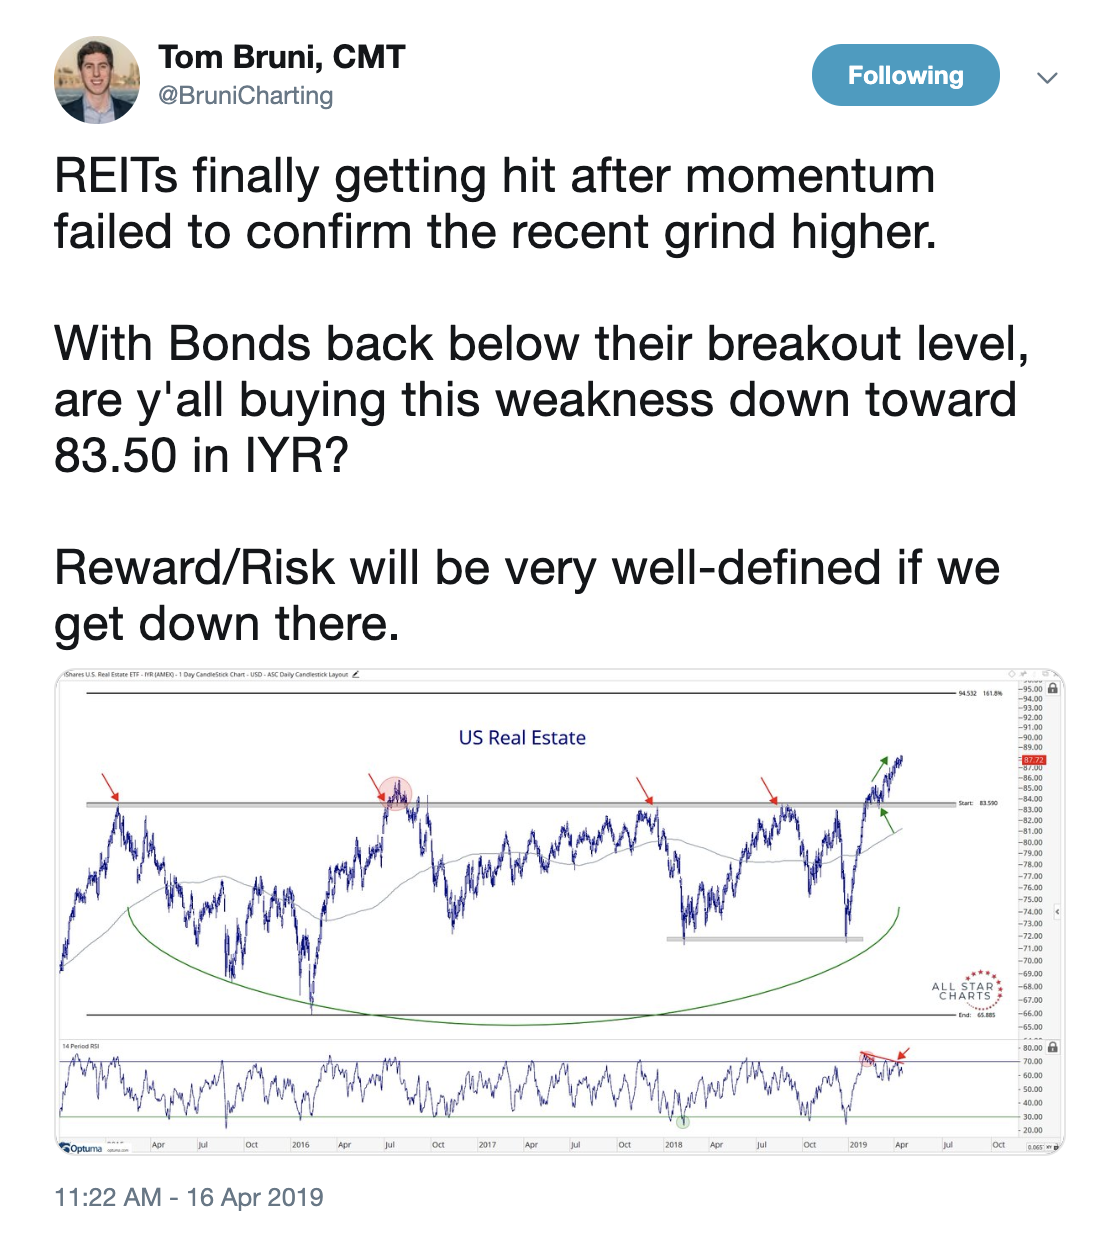
Today’s chart of the day was shared on Twitter by Tom Bruni (@BruniCharting). It’s a long-term chart of the US Real Estate ETF ($IYR). Real Estate has been the worst performing sector for two day’s in a row now. Bruni explains that the ETF was bound for a pullback because momentum (RSI) was making lower highs as price was making higher highs. This is called a bearish momentum divergence. Despite expecting short-term weakness, he thinks it could be a good buy if it comes down to former resistance at the $83.50 level. This should now act as support presenting a well-defined risk/reward setup.
Quote of The Day
“Big Money is made in the stock market by being on the right side of major market moves. I don’t believe in swimming against the tide”
– Martin Zweig (American Investor)
A Gigantic Thrust in Breadth – The Chart Report
Here’s a piece from The Chart Report talking about the recent breadth thrust the US stock market has seen lately. We define what a breadth thrust is, and what this signal means for the overall market outlook.
Podcast with Craig Johnson, Chief Market Technician at Piper Jaffray – Technical Analysis Radio
In this week’s Technical Analysis Radio podcast, JC Parets interviews Craig Johnson. Craig is the Chief Market Technician at Piper Jaffray and former president of the CMT Association.
The Inverse Head and Shoulders in the Transports – Greg Harmon
Greg Harmon breaks down the bullish pattern he’s seeing develop in the Dow Transports and explains what it could mean for the overall market.
Sector Charts – Consumer Discretionary – Bespoke
The Consumer Discretionary sector has been one of the best performing sectors YTD. This note takes a deep dive into some of the individual stocks within the sector. They point out that Hasbro ($HAS) is one of the only components in a downtrend.
3 Key S&P 500 Sectors to Watch – Dan Russo
Here’s Chaikin Analytics’ Stock Market Today video in which, Dan Russo points out the most important sectors and levels to keep an eye on right now.
Top 10 Tweets
#China's Shanghai Composite Index closed at its highest level since March 2018 today! pic.twitter.com/IO0pnTu9f7
— jeroen blokland (@jsblokland) April 16, 2019
Emerging Market volatility is beginning to reach levels it hasn't seen very often. $EEM pic.twitter.com/2FamHm0BpN
— Andrew Thrasher, CMT (@AndrewThrasher) April 16, 2019
$XLP Consumer Staples has been the 3rd best performing group in the past 5 days, showing better performance than Technology, Discretionary and industrials- This outperformance could continue given $XLP exceeding a meaningful resistance Trend from last Feb highs pic.twitter.com/TMzipCVocB
— Mark Newton (@MarkNewtonCMT) April 16, 2019
The euro has established a positive divergence against the dollar near channel support; a breakout above the 200-day MA (1.144) would mark an important shift #EURUSD pic.twitter.com/TusVCQRexp
— Katie Stockton, CMT (@StocktonKatie) April 16, 2019
Officially broken down? $GC_F pic.twitter.com/4DEHnsOzup
— Dow (@mark_dow) April 16, 2019
At first, I thought I saw an ascending triangle in $GOLD, but after a 2nd glance, we can instead see rising bottoms accompanied w/ lower highs all within the context of a flat-to-rising 200MA.
This looks like possible continuation here w/ a clear exit around $1,285.$GLD $IAU pic.twitter.com/McG8hHrx0I
— Adam D. Koos, CFP®, CMT (@AdamKoos) April 16, 2019
A breakout in Copper would seem to be strong evidence that the global economy is indeed improving (going from less bad to actually better). It's close, but not there yet. pic.twitter.com/BY9v51hmV5
— Willie Delwiche (@WillieDelwiche) April 16, 2019
Is Bitcoin a buy? If we're above 4600 I don't mind a long position with a target near 7400. The risk vs reward makes sense, which is all we really care about $BTCUSD $BCOIN #Bitcoin pic.twitter.com/UoUWwEKSV4
— J.C. Parets (@allstarcharts) April 15, 2019
$TSCO Monthly breakout from 4-year base pic.twitter.com/5UhepOrUrK
— Cody Freeman (@ZenTrends) April 16, 2019
The five-day chart of $FXI is good for a chuckle. "We trade either at $44.50 or $45.50 – nothing in between…" pic.twitter.com/Ygcv8vM63F
— Michael Santoli (@michaelsantoli) April 16, 2019