Chart of the Day - Friday, August 1, 2025
August 1, 2025

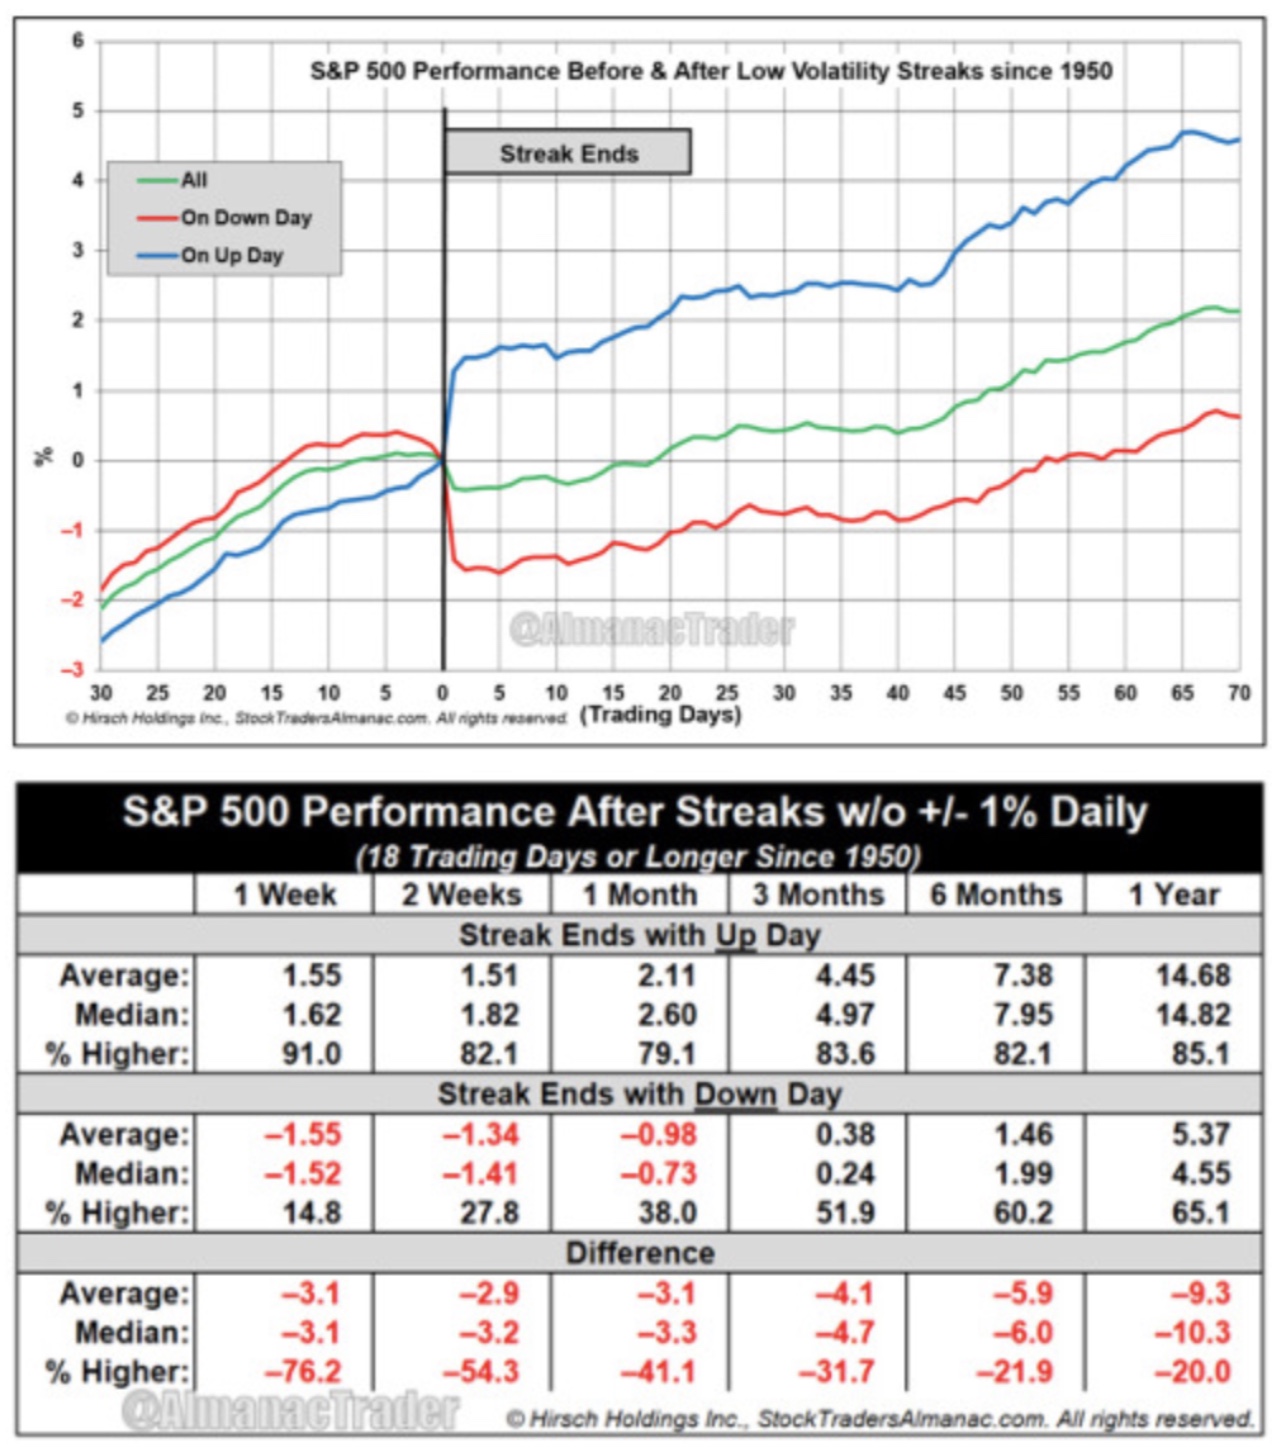
🏆 Today's Chart of the Day was published in a recent note by Jeff Hirsch (@AlmanacTrader).
- The S&P 500 dropped -1.6% on Friday, ending a 26-day streak without a 1% move in either direction. Jeff points out that how these low-volatility streaks end has historically set the tone in the near term.
- Since 1950, there have been 175 low-volatility streaks lasting at least 18 consecutive days without a 1% move. The majority (62%) ended with a -1% decline, just like Friday.
- When these streaks ended with a +1% gain, the next week was higher 91% of the time, by an average of +1.6%. However, when they ended with a -1% loss, the index struggled for another 1-4 weeks on average.
The Takeaway: The S&P 500 fell -1.6% today, ending a 26-day streak without a 1% move in either direction. Jeff notes that when these quiet stretches end with a -1% loss, like today, the near-term outlook has historically been much weaker than when they end with a gain.
