Sponsored By:

Today’s Summary
Friday, June 28th, 2019
Indices: US stocks were higher in today’s session with the Dow Jones Industrial Average gaining 73 points or 0.28%. The Russell 2000 outperformed the rest of the major indices, gaining 1.29%.
Sectors: Financials led, for the second day in a row, gaining 1.43%. Consumer Staples lagged, falling just 0.04%.
Commodities: Crude Oil futures were lower by 1.61% to settle at $58.47 per barrel. Gold futures were higher by 0.30% to settle at $1,415 per ounce.
Currencies: The US Dollar Index was flat, changing just 0.01%.
Interest Rates: The US 10-year Treasury yield moved higher to 2.007%
Here are some of the best charts, articles, and ideas being shared on the web today!
Chart of the Day
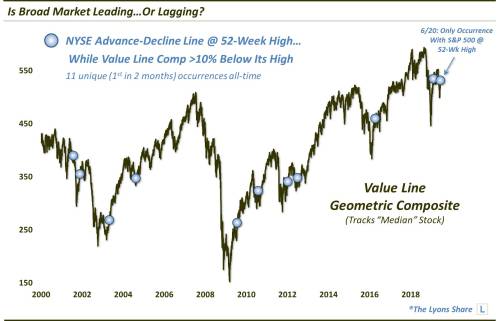
Today’s chart of the day was shared in a blog post titled: “Is Broad Stock Market Leading or Lagging?” by Dana Lyons (@JLyonsFundMgmt). The chart shows one commonly used breadth indicator, the Value Line Geometric Composite Index. It tracks the performance of the “median” stock across 1,675 stocks within the NYSE. As you can see, the Value Line Composite has failed to print a new 52-week high this year. On the other hand, the NYSE Advance-Decline Line, another popular breadth metric, is at a 52-week high. Other breadth metrics like the NYSE percentage of stocks above their 200-day moving averages are also diverging from the S&P 500. Clearly, the most commonly used breadth indicators are sending mixed signals, making it difficult to analyze the internals of the market right now.
Quote of The Day
“Yesterday’s home runs don’t win today’s games.”
– Babe Ruth (Professional Baseball Legend)
Top Links
In this Real Vision interview, Thomas Thorton of Hedge Fund Telemetry lays out a bearish trade on Bonds. His thesis is largely based on Demark Indicators signaling a trend change for the 10-year treasury yield.
Could Silver Price Soon Start Outperforming Gold Price? – DailyFX
The Gold/Silver ratio is often used as a gauge of risk appetite in precious metals markets. This piece from DailyFX examines the charts of both Gold and Silver, as well as the ratio of Gold/Silver.
Defensive Sectors Fall Behind While Technology, Cyclicals, and Industrials Take the Lead – StockCharts.com
Here’s a short note from the legendary technician, John Murphy. He provides a quick update on the S&P 500 sectors and highlights the areas of the market that have made significant moves this month.
July’s First Trading Day – Most Bullish Day, S&P 500 has Advanced 85.7% of the Time – Almanac Trader
Here’s a short read from seasonality expert, Jeff Hirsch. He explains that the first trading day in July is, on average, the best performing first trading day of all 12 months.
My Advice for New Investors – All Star Charts
This is a great video from JC Parets of All Star Charts. He offers up his best advice to new market participants and hammers home the importance of Risk Management.
Top 10 Tweets
At the close of Q2 the $SPX is set to confirm an Inside/Up continuation pattern.
Its still a Bull Market folks and nothing anyone can say will change that pic.twitter.com/ZyzHI3DAEi
— Cody Freeman (@ZenTrends) June 28, 2019
Sml cap R2000 has not advanced the last 18 mos, far behind large caps (R1000)
Worse, remove FAANG+MSFT from the SPX and the remaining 494 stocks are up 2.59% (Tbills up 3.12%) and the FAANG-M added 3.90% to the SPX.
The entire stk mkt return last 18 mos just 6 stks? pic.twitter.com/UmRSkMuD76
— Jim Bianco (@biancoresearch) June 28, 2019
Small-cap breadth came alive on Thursday with $SML AD Percent exceeding +80% for the first time since early June and outpacing $MID AD Percent (+73%) and $SPX AD Percent (+54%). AD% = (Advances-Declines)/Total Issues. pic.twitter.com/PRZrDllVqy
— Arthur Hill, CMT (@ArthurHill) June 28, 2019
Could $USO have 3 straight daily dojis? Exciting stuff. @allstarcharts pic.twitter.com/BDO29Dy5on
— Mike Zaccardi, CFA, CMT (@MikeZaccardi) June 28, 2019
I hope everyone is enjoying their #Coffee today. It just got a little more expensive after breaking through resistance at 107 in style and setting a higher high for the first time since Nov. pic.twitter.com/9ctIxEkkOc
— David Brady (@GlobalProTrader) June 28, 2019
another good reason to be watching the US Dollar Index up here $EEM $SPY $DXY pic.twitter.com/imZnltQ53n
— J.C. Parets (@allstarcharts) June 28, 2019
Shhhhh pic.twitter.com/rYFovAjPhE
— Downtown Josh Brown (@ReformedBroker) June 28, 2019
Great chart showing what a wild quarter Bitcoin has had https://t.co/umK2PcFqKp pic.twitter.com/CAkJqohCCS
— Joe Weisenthal (@TheStalwart) June 28, 2019
Last chance to short Avocados pic.twitter.com/QrqSrFUdpE
— Tom Hearden (@followtheh) June 28, 2019