Every weekend, I review hundreds if not thousands of charts across U.S. indices, global markets, breadth, sentiment, and intermarket relationships.
And now I’m opening up my stalk list.
The names that stood out the most from my review.
This Week’s Theme: Let The Dust Settle
After ripping through the charts this weekend, it’s hard to have short-term conviction.
Stocks took a solid punch to the face this week, and now we need to see how they respond.
It’s still a Bull Market it's just not the time to be flooring it.
Sometimes the best move is to let the dust settle so you can see what road you’re actually on.
Let’s get into it.
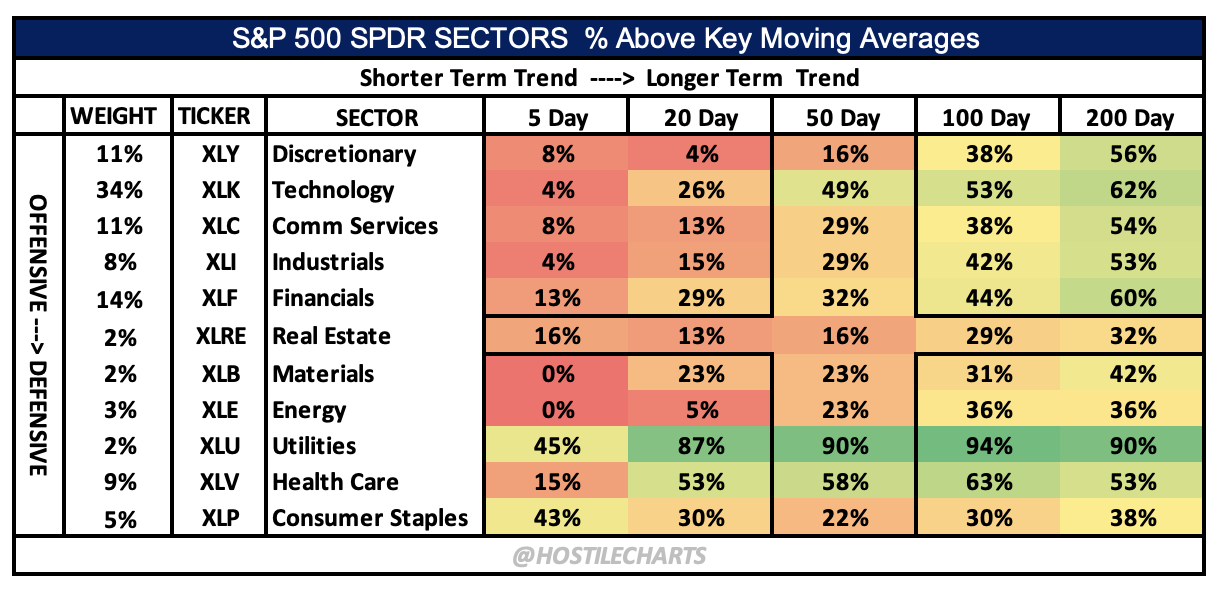
Breadth - "The Market of Stocks"
Breadth is something I keep an eye on every week. The "Market of Stocks" really shows the health of the underlying market. The index fails to tell the whole story when it's extremely concentrated within Tech.
The short-term weakness in 5/10/20-day breadth has started to trickle into the 50-day trends, it’s not a great look, but the structural trends still favor the bulls.
I’ll be stalking this chart closely this week to see if the short-term breadth can stabilize and follow through into a recovery that realigns with those longer-term uptrends. Weak short-term breadth + steady long-term footing = a setup for tactical opportunities once the short-term flush runs its course.
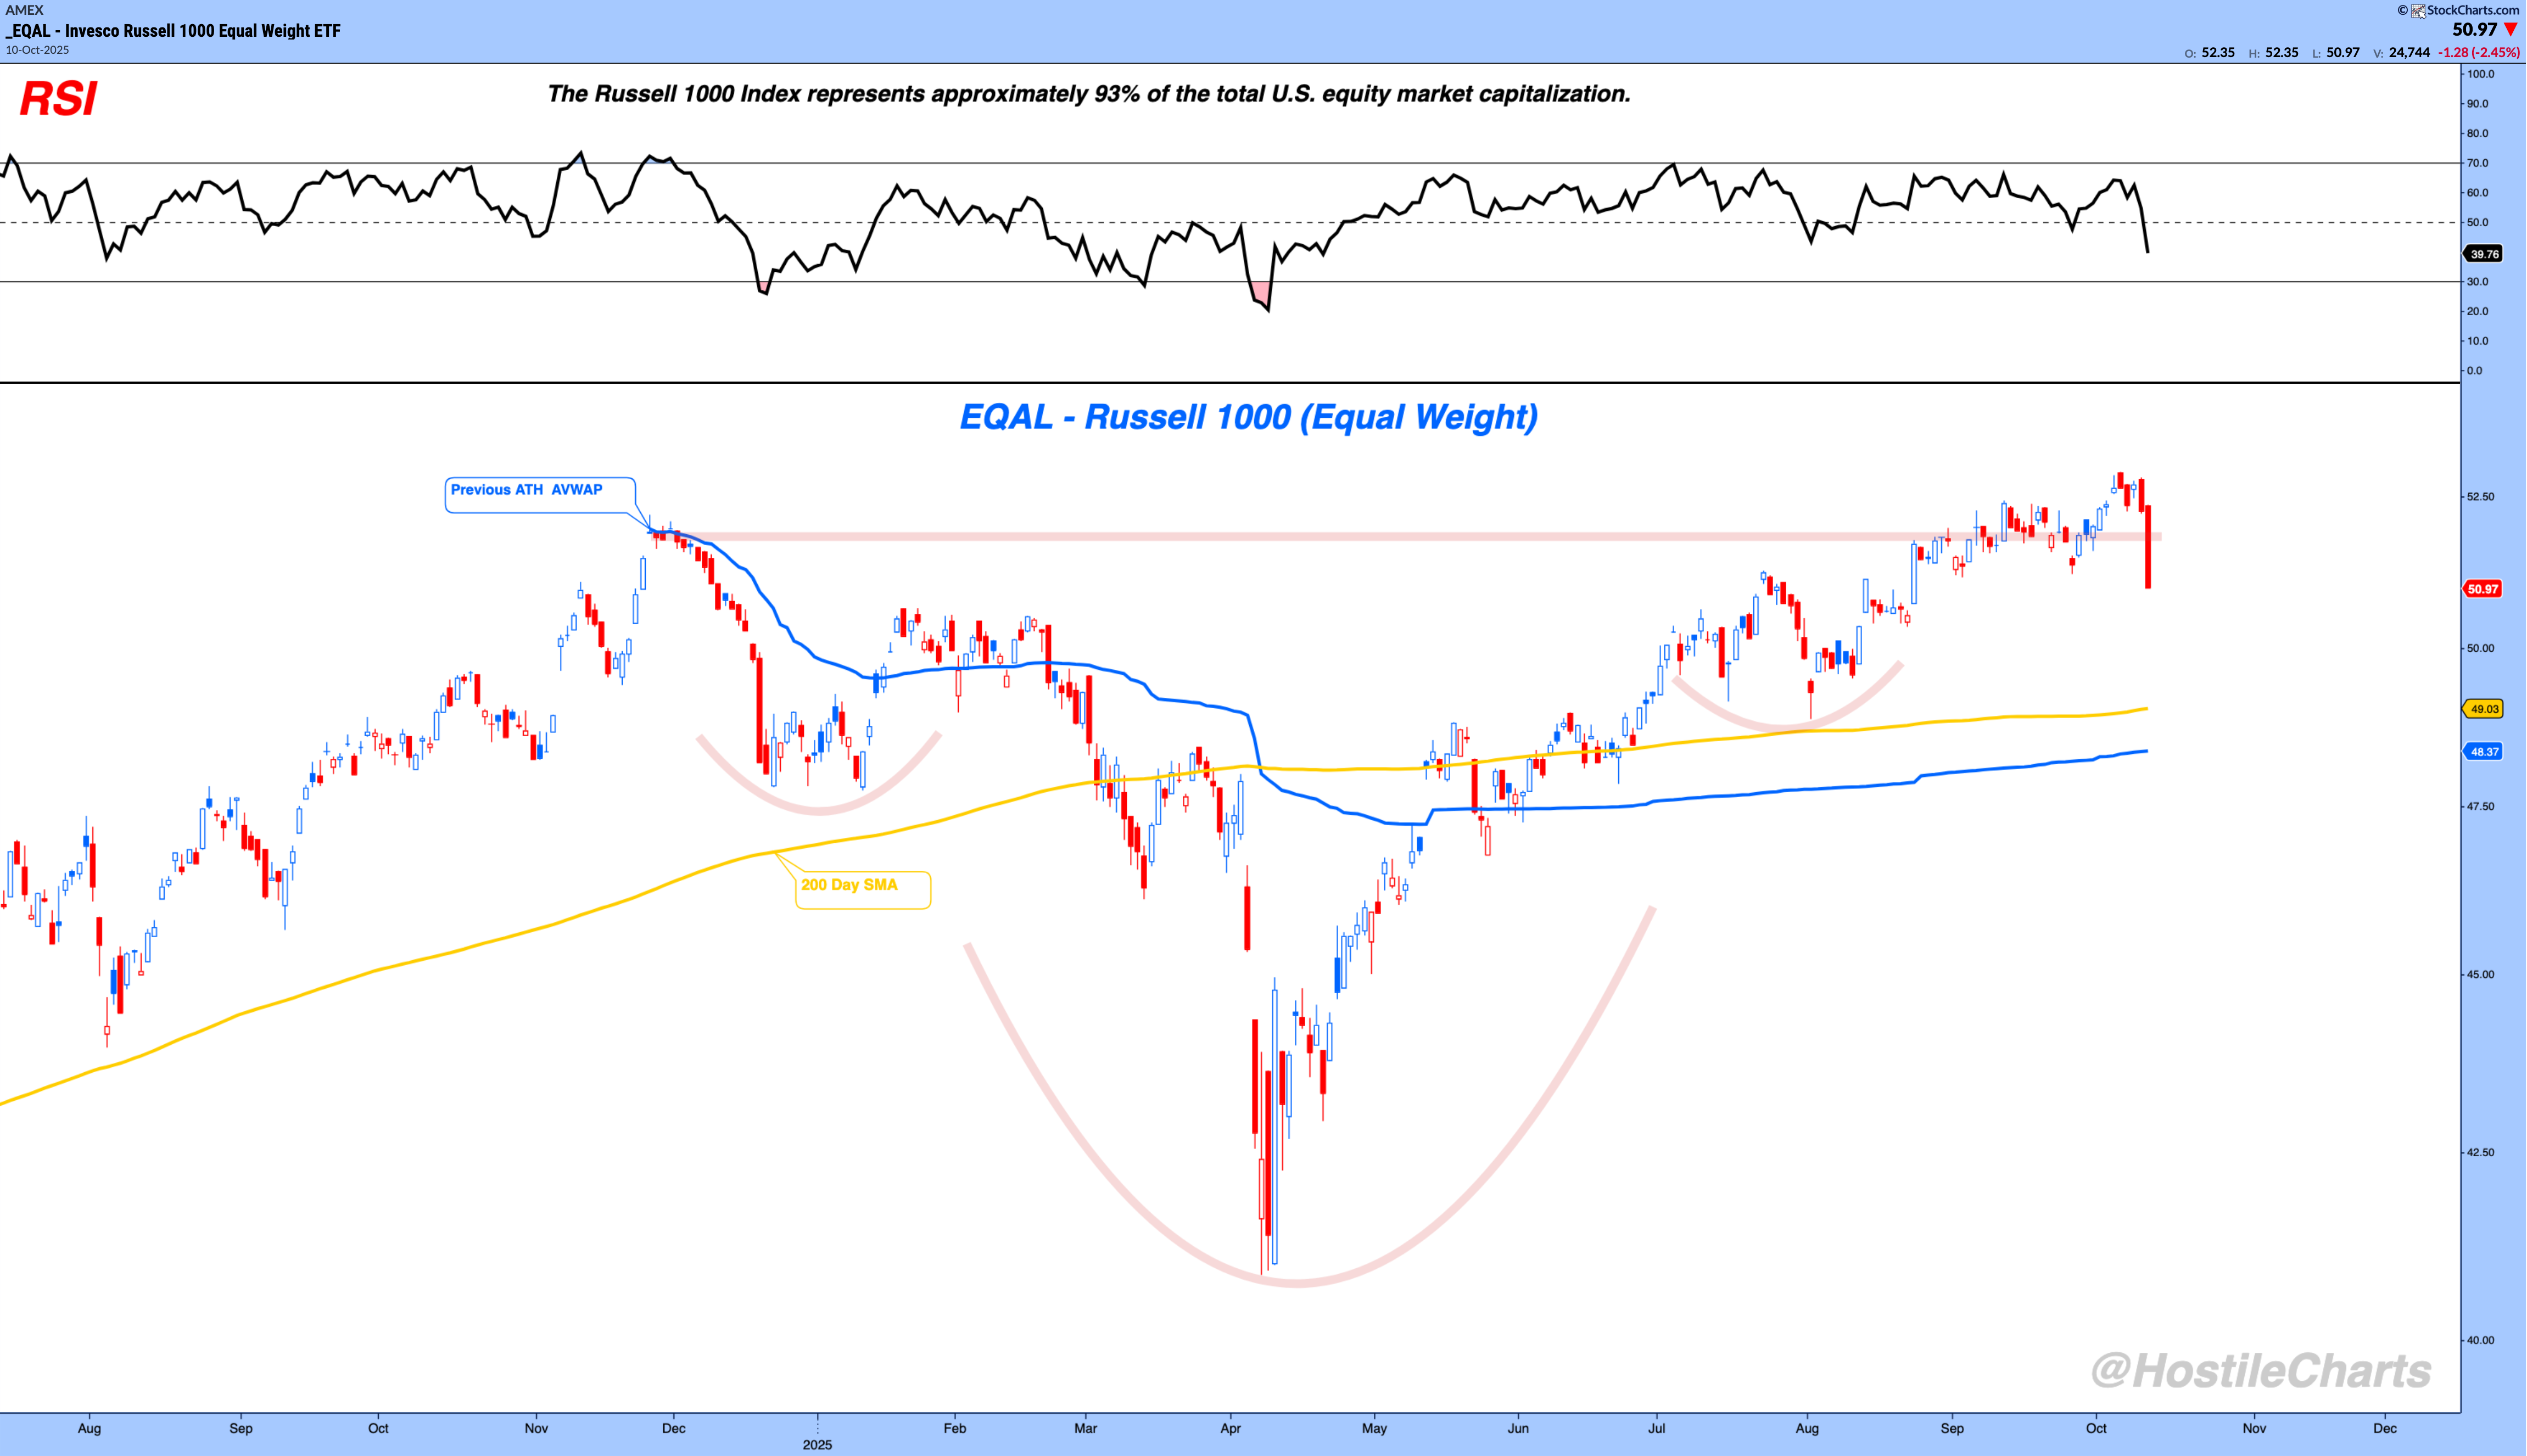
$EQAL - Russell 1000 Equal Weight
If I could only have one ETF to represent the market of stocks, it’s hard not to choose the Russell 1000 Equal Weight (EQAL). It represents over 90% of total U.S. equity market capitalization, with all 1,000 names getting an equal vote.
This chart shows the failed breakout that occurred this week, two days wiping out weeks of price action.
It’s a tough look for the broad market and a reminder that even when structure looks strong, momentum can vanish quickly.
I’m eyeing the previous all-time high AVWAP and the 200-day moving average as potential support.
They’re about another 4–5% lower, which would make for a healthy correction, but healthy corrections can make you feel sick in the moment.
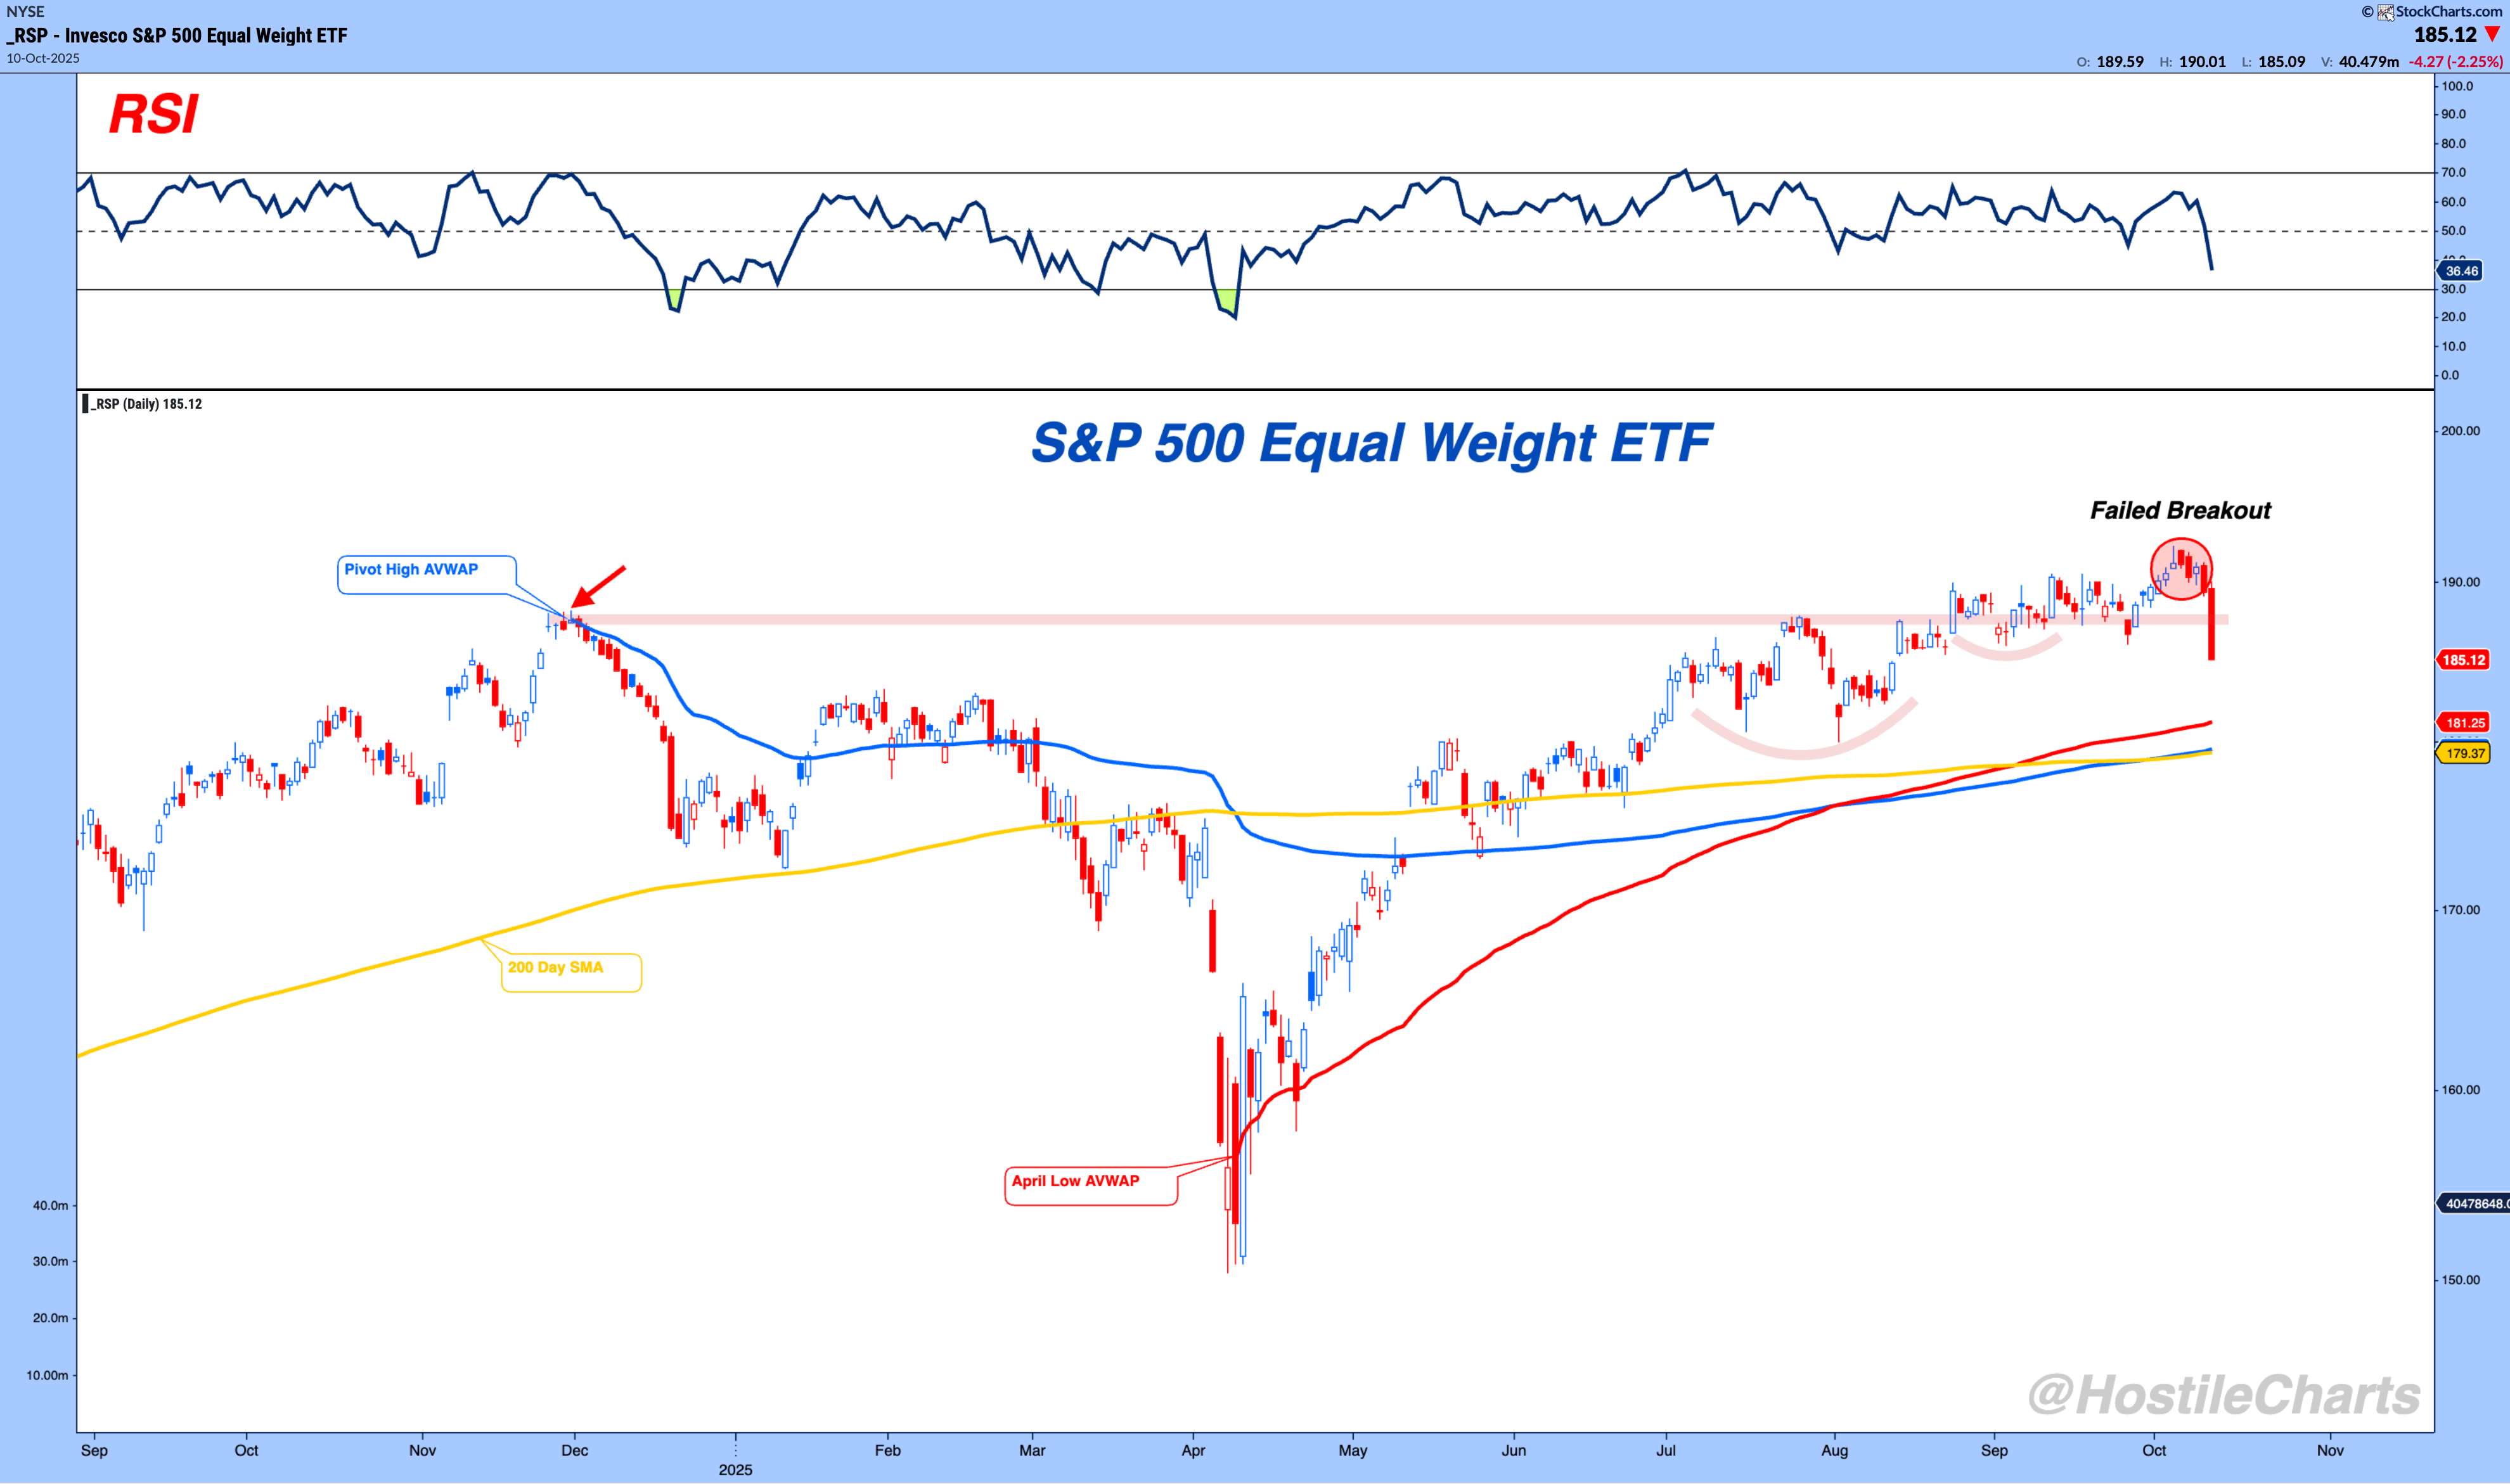
$RSP - S&P 500 (Equal Weight)
The big guys casting 500 votes are also saying the failed breakout is a theme, not an exception.
Equal weight tells the real story and the average stock is feeling it.
Once again, solid support sits below, and I’ll be watching closely this week to see if buyers show up where they need to.
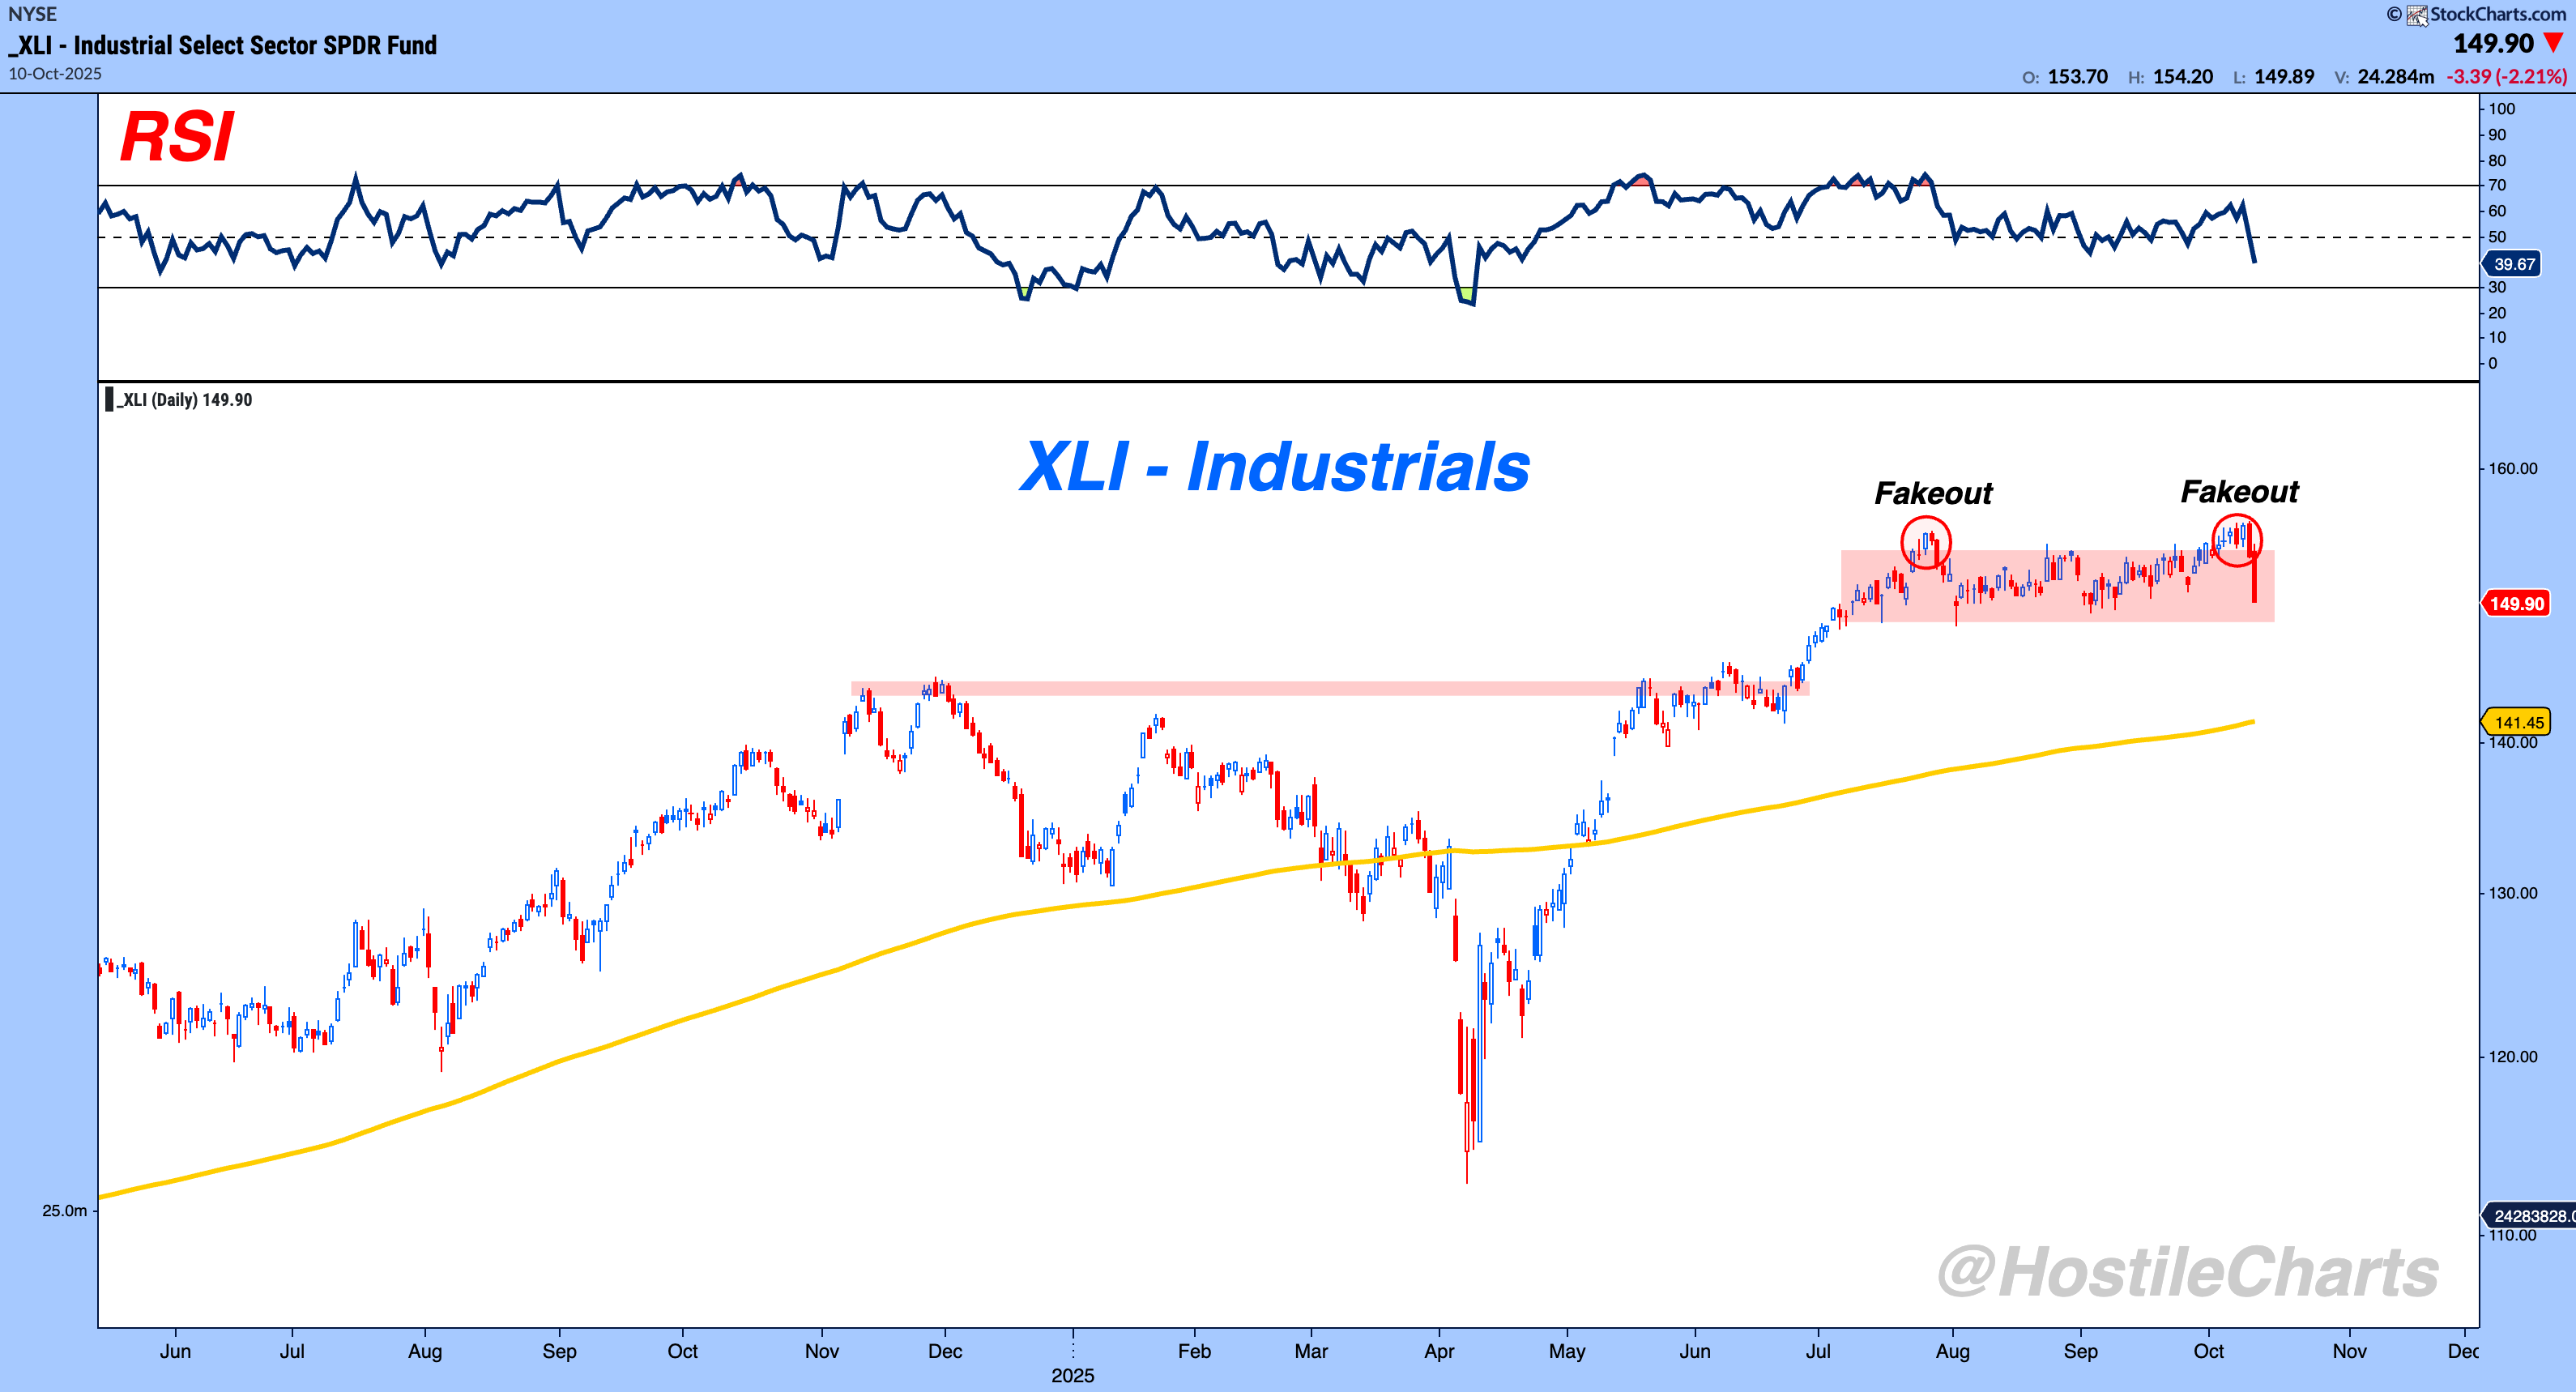
Sector Watch
$XLI - Industrials
Industrials are back in the penalty box. I track this group closely because they tend to move in step with economic activity. For now, it’s just a reset — back to a consolidation within a broader uptrend. What I don’t want to see is this morph into a breakdown.
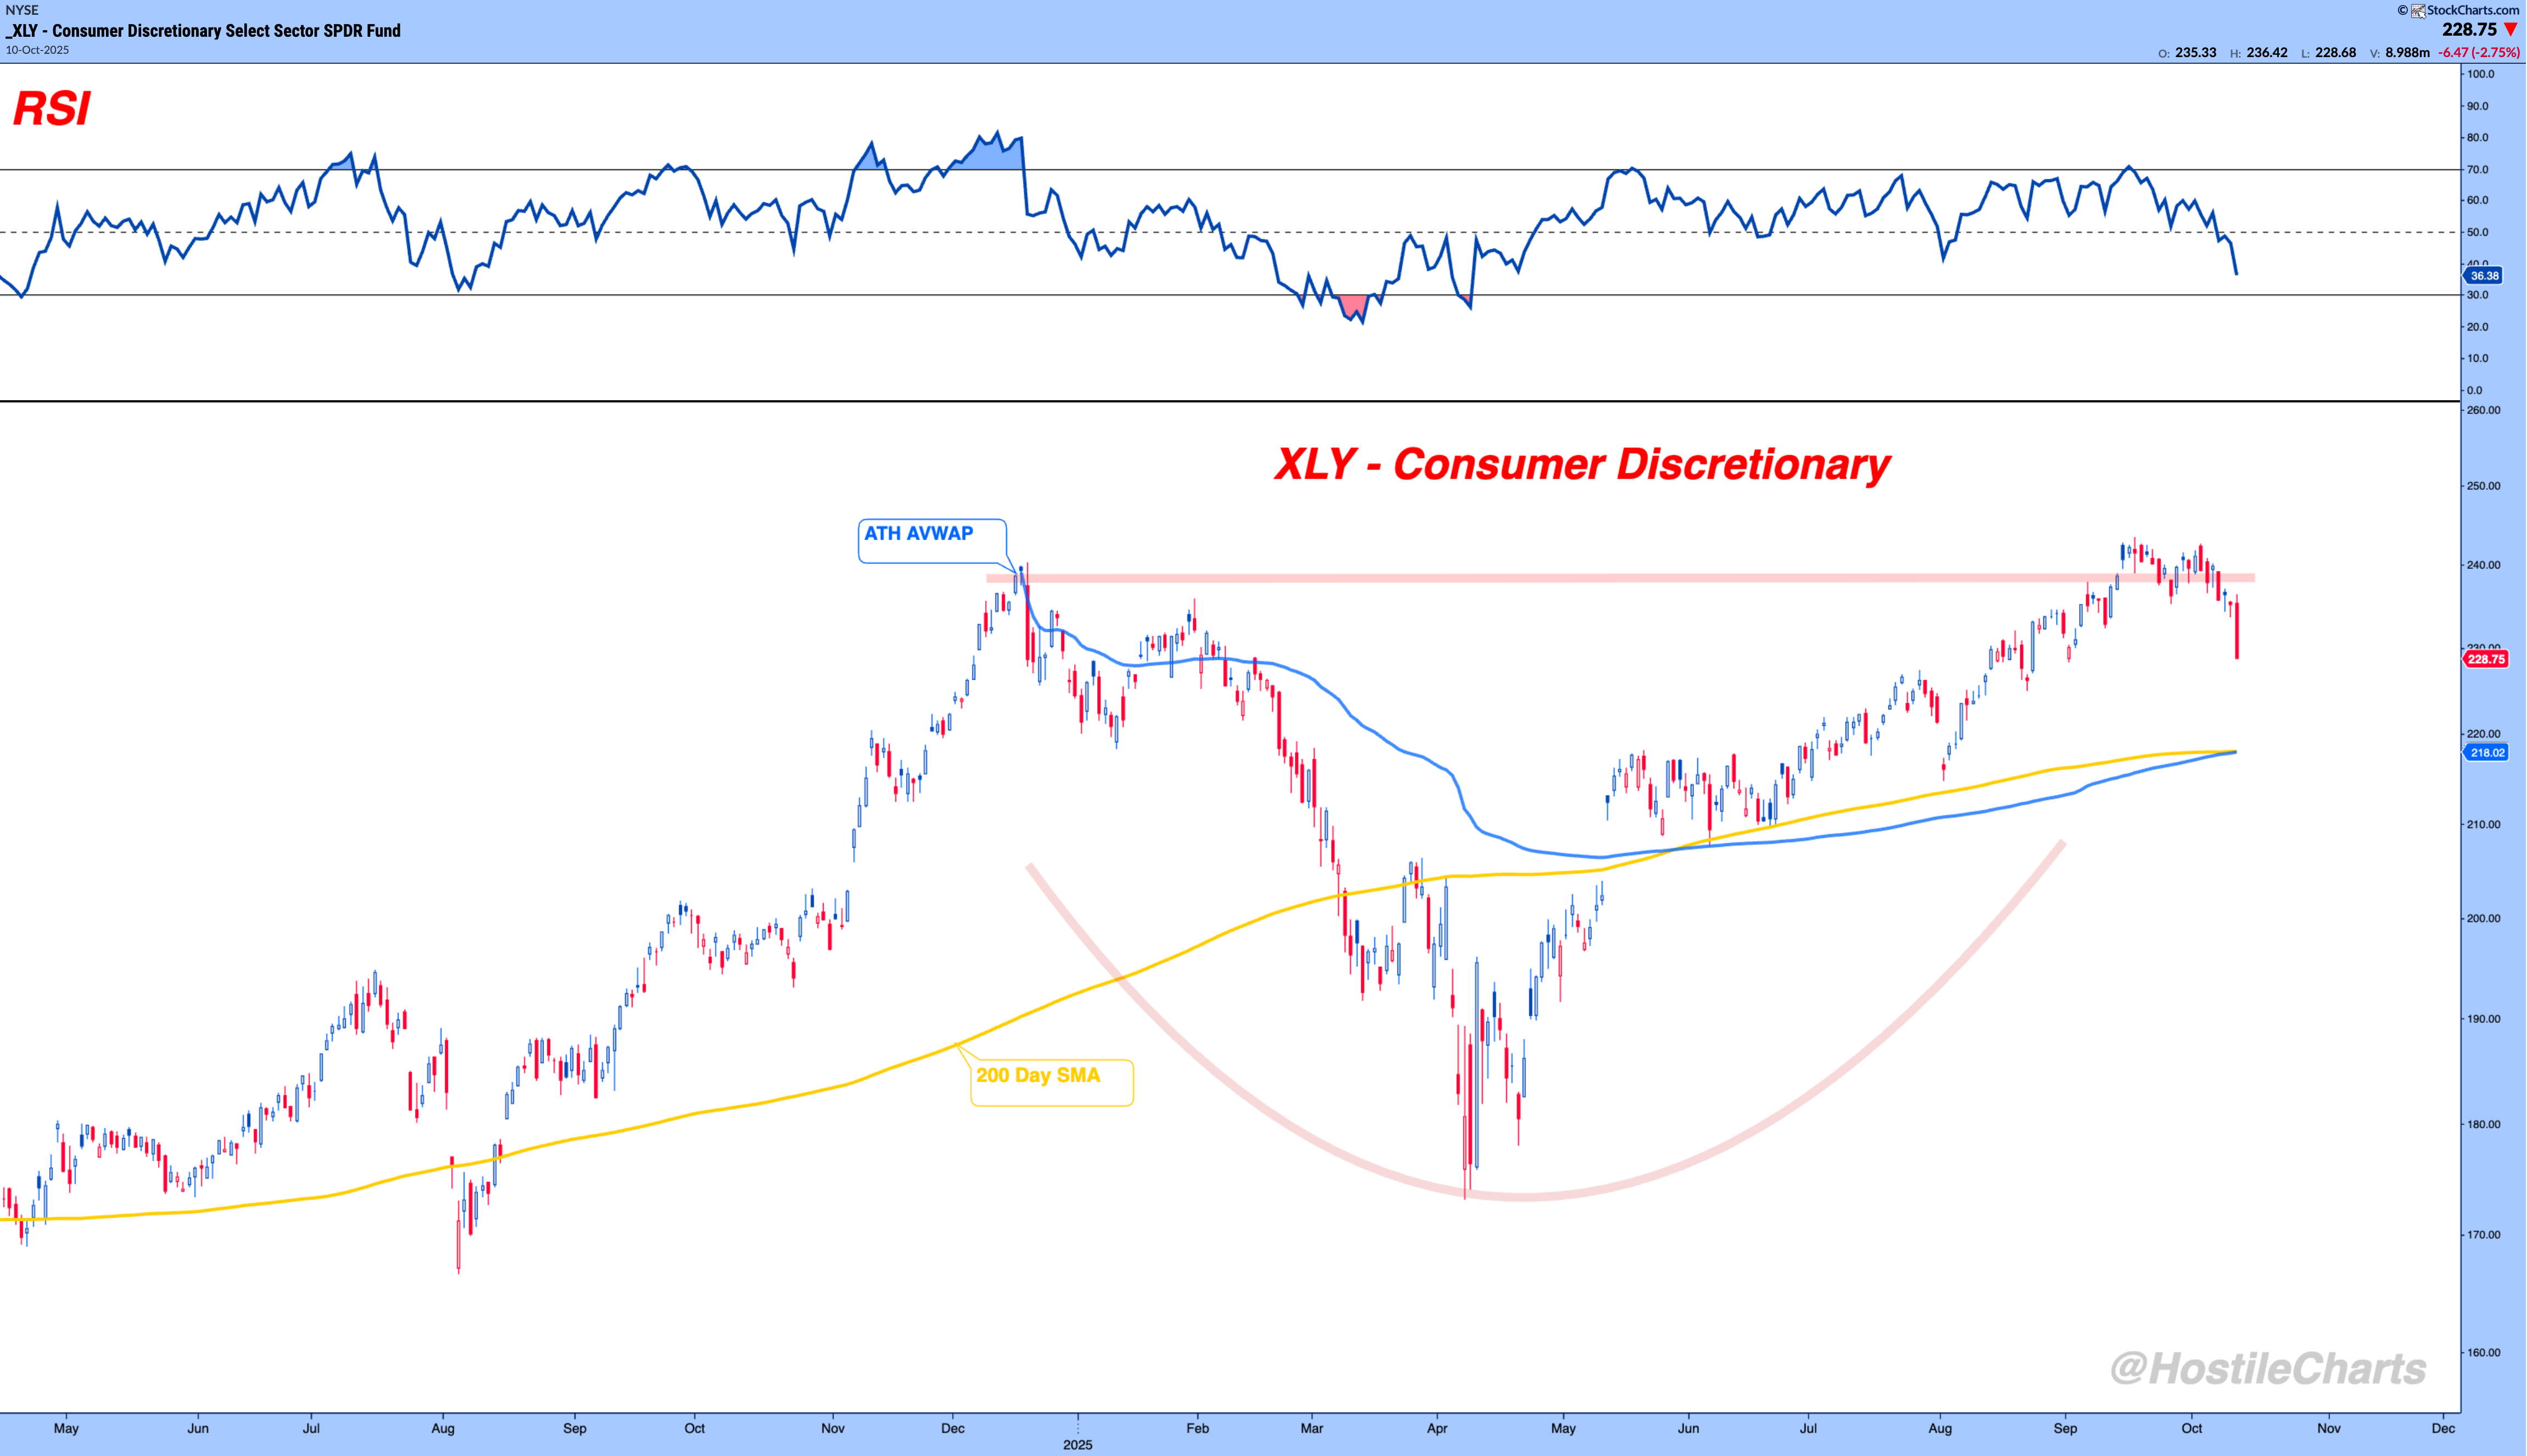
$XLY - Consumer Discretionary
You can see the theme here....another failed breakout, and this time in one of the most offensive corners of the market.
There’s solid potential support below, but short-term momentum has to stop going down before I start thinking about it going up.
Industry Watch
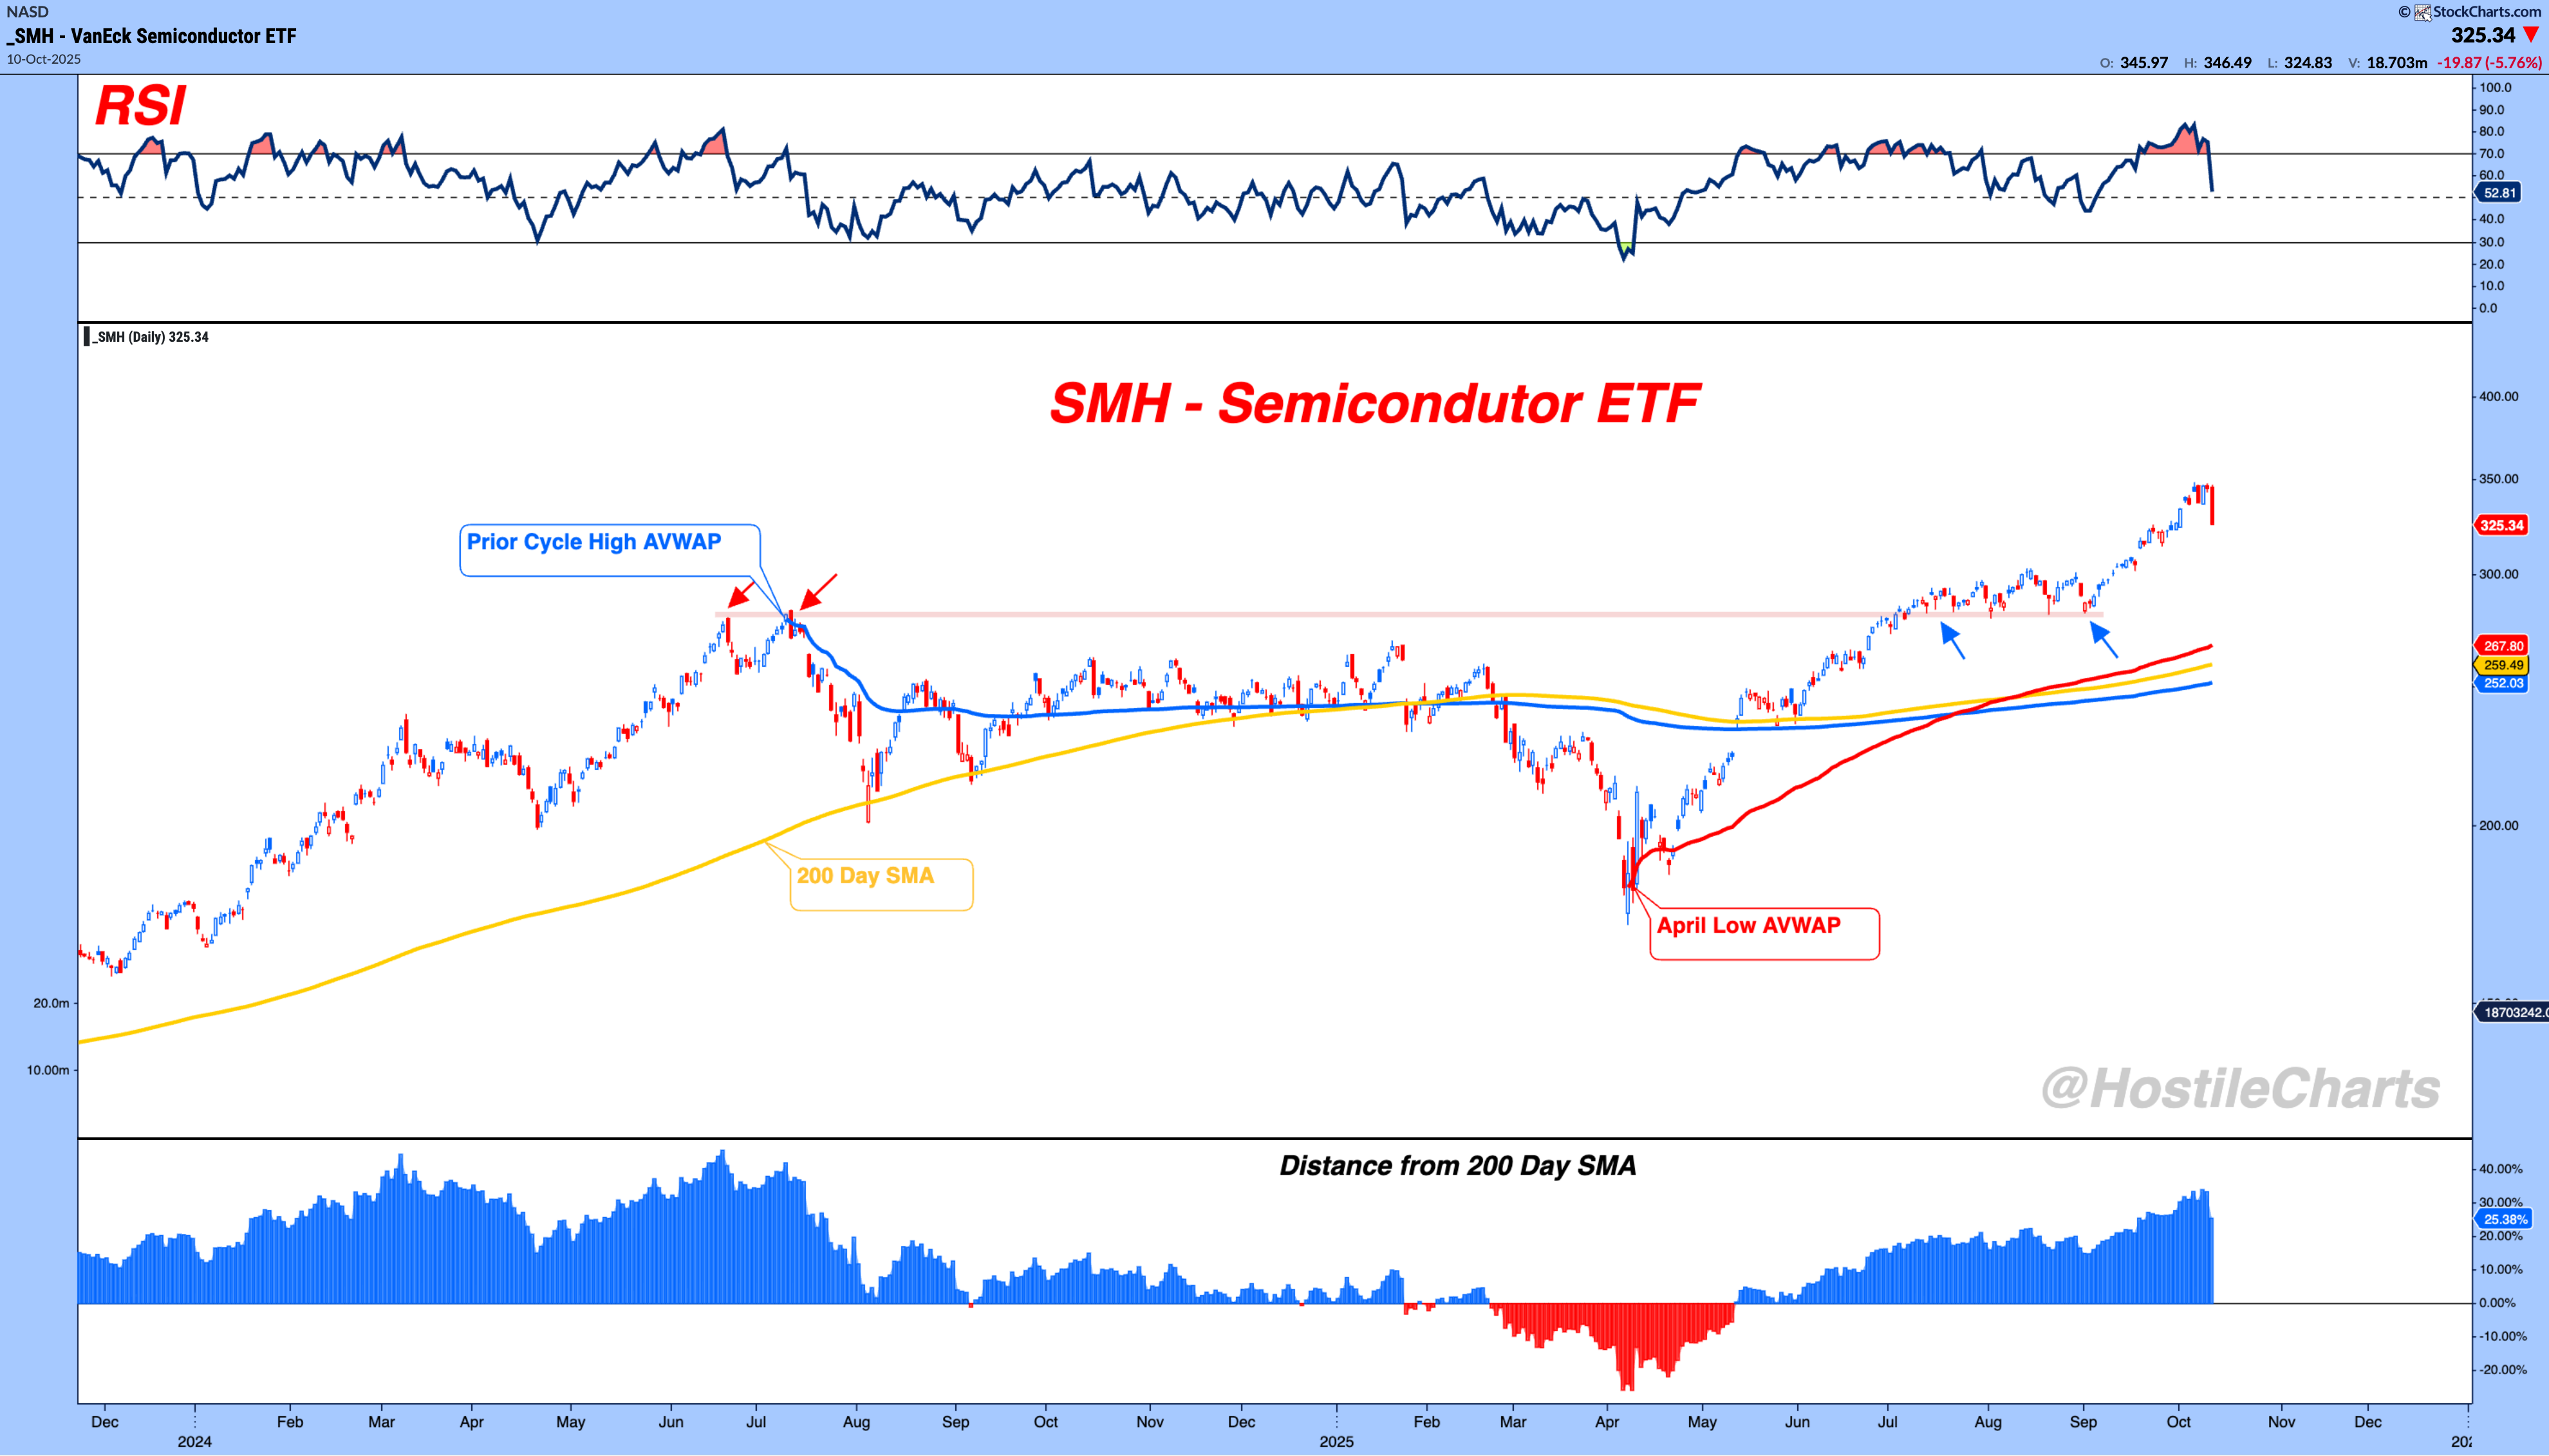
$SMH - Semiconductors
I know my work might sound a little too bearish lately, but let’s keep it real — Friday was just a solid punch from the bears.
In context, plenty of strong trends were stretched and due for a pullback. Take Semis, the largest single industry in the S&P 500.
Coming into Friday, we were over 30% above the 200-day moving average. A breather was inevitable. This isn’t panic time. It’s patience time.
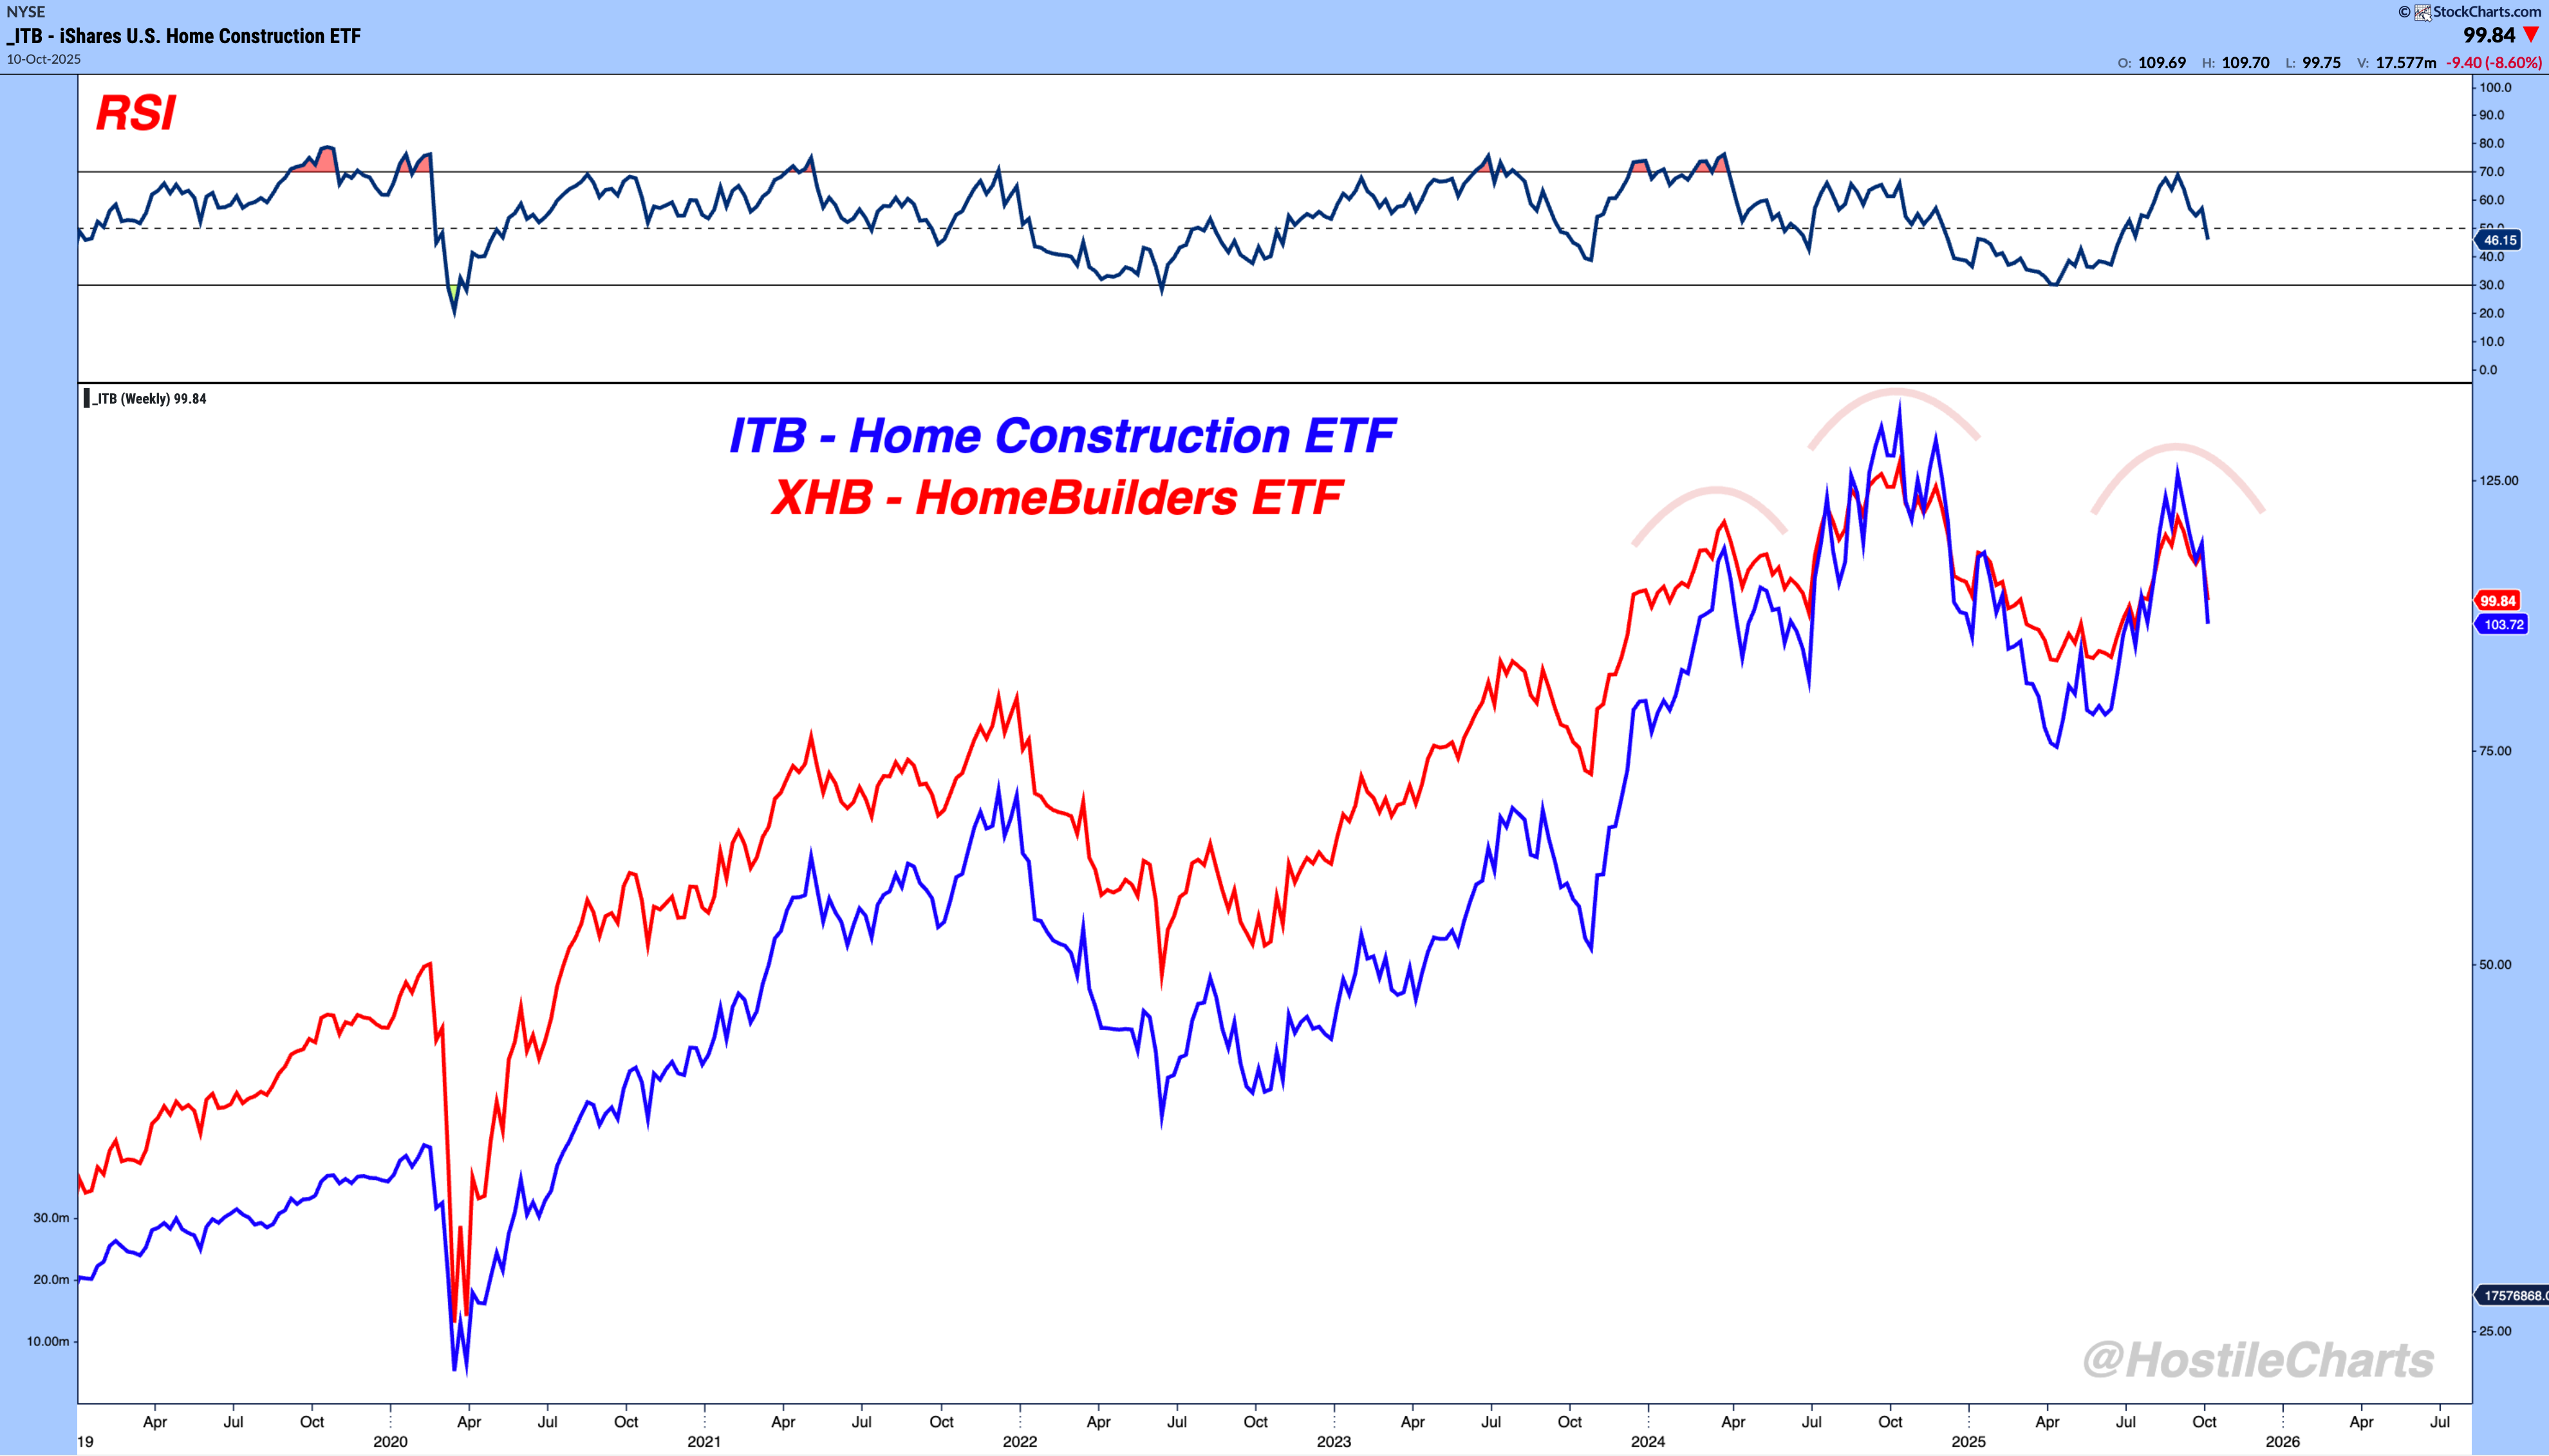
$XHB / $ITB - HomeBuilders & Home Construction
Homebuilders and Home Construction are one of the biggest black eyes on the market right now.
Housing trends ripple through everything. They shape investor sentiment, confidence, and even spending habits.
I’m stalking this POTENTIAL top like a hawk. I’ve talked about the significance before, and I broke it down again in this week’s All Gas No Brakes.
My Two Cents
The market can look scary when the bears land a punch, but zoom out and the structure is still intact.
I’ll be stalking hundreds of charts this week, but the setups above, plus the 20 I broke down in this week’s All Gas No Brakes, should give plenty of insight into when and if the road clears up.