Sponsored By:

Today’s Summary
Thursday, December 19th, 2019
Indices: US stocks closed higher in today’s session with the Dow Jones Industrial Average gaining 138 points or 0.49%. The Nasdaq was the strongest of the major averages, advancing 0.67%, while the S&P 500 rose 0.45%. The Russell 2000 slightly lagged the rest of the pack but still moved higher by 0.32%.
Sectors: Real Estate led for the second day in a row, gaining 1.03%. Energy and Financials were the only sectors to close lower, both slipped just 0.03%.
Commodities: Crude Oil futures moved higher by 0.54% to $61.18 per barrel. Gold futures also moved higher by 0.39% to $1,482 per ounce.
Currencies: The US Dollar Index was flat.
Interest Rates: The US 10-year Treasury yield was little changed and is at 1.924%.
Here are the best charts, articles, and ideas being shared on the web today!
Chart of the Day
This interest rate forecast chart from BBG/WSJ is one of my favorites from 2019.
LESSON: Don't get married to forecasts – follow price! $STUDY pic.twitter.com/h5ZeY1gQ2w
— Matt Weller CFA, CMT (@MWellerFX) December 19, 2019
Today’s Chart of the Day was shared on Twitter by Matt Weller of FOREX.com (@MWellerFX). With the new year around the corner, analysts have been offering up their 2020 forecasts left and right. This chart illustrates why it’s essential to take these year-end price targets and forecasts with a grain of salt. The chart shows analyst predictions for the US 10-year Treasury yield, as you can see, nobody predicted yields would fall the way they did. We believe year-end price targets and forecasts are kind of silly. Sure, these predictions can be necessary to make long-term decisions, but let’s be honest, nobody has a crystal ball. Anyone who confidently tells you they know where the S&P 500 will end in 2020 is full of $h!t. Instead of trying to predict, we think it’s better to keep an open mind, focus on the trend, and asses new information as it becomes available throughout the year. As Matt says, “follow price!”
Quote of the Day
Top Links
Bull Stampede – SentimenTrader
Jason Goepfert of SentimenTrader points out some signs of emerging optimism among investors.
Why You Should Care About Yen/Aussie Dollar – All Star Charts
Tom Bruni explains that the Yen/Aussie Dollar currency pair can be used to gauge risk-appetitie.
Facebook Needs to Clear This Level to Kick Off Next Major Rally, Chart Suggests – CNBC
Katie Stockton of Fairlead Strategies shares her technical perspective on Facebook ($FB) and Twitter ($TWTR).
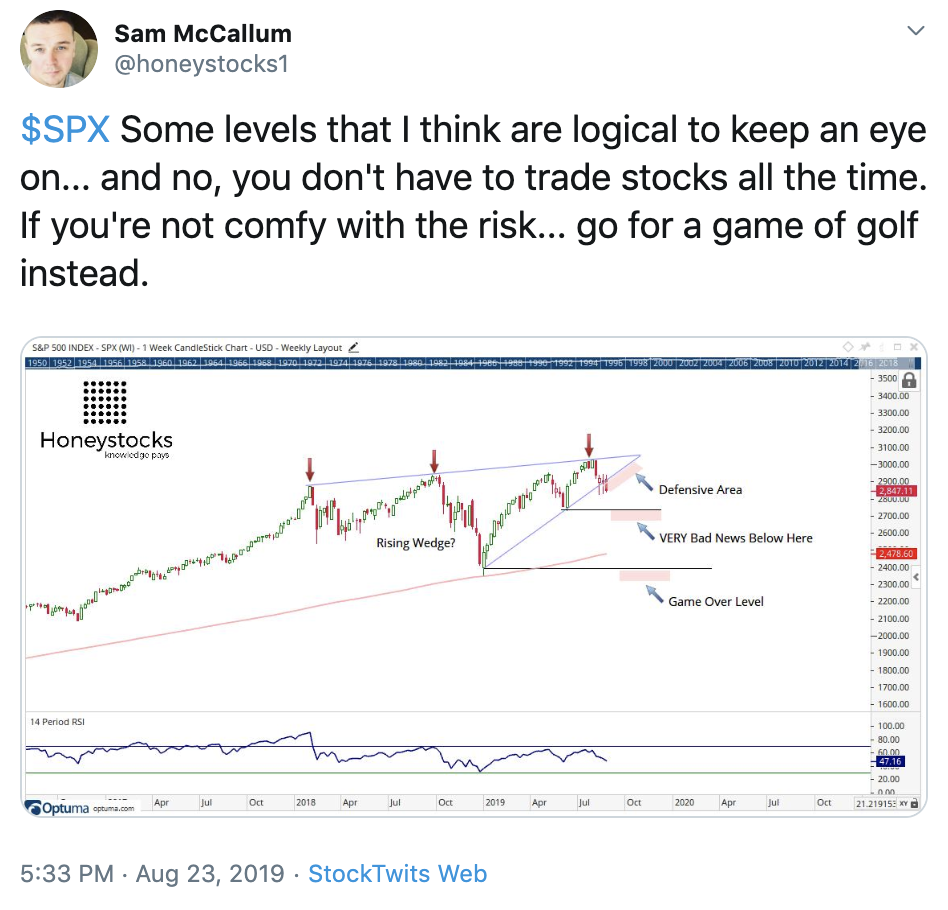
20 Charts to Watch Closely in the Run-up to Xmas? – Honey Stocks
In this video, Sam McCallum presents a few attractive chart setups that are worth keeping an eye on.
S&P 500 Drawdowns by Year – Bespoke
Bespoke highlights the fact that 2019 was a pretty smooth year for investors. The maximum drawdown this year was only 6.84% despite the glut of bearish headlines.
Top 10 Tweets
It was the best of times…
S&P 500: All-Time High
Dow: All-Time High
Nasdaq: All-Time High
NYSE: All-Time High
Mid-Cap 400: All-Time High
Wilshire 5000: All-Time High
Global Dow: All-Time High
?????? ? pic.twitter.com/kXxcV4HQlI— Charlie Bilello (@charliebilello) December 19, 2019
Rally in $SPX getting a little extended. Some choppiness to be expected, but it doesn’t appear that the rise is done just yet. Still ok to be long. Watch 3150 and 3080 as support. pic.twitter.com/IaZelJbocN
— Jim Denholm, CMT (@denholm_jim) December 19, 2019
How long can the Equity P/C ratio stay this low?
Probably longer than you'd imagine. pic.twitter.com/XbmRgtuXXv
— Adaptiv (@adaptiv) December 19, 2019
$SPY 10% rally over past 50 market days is unusual in that it isn't following a meaningful decline. Last 5 times we have seen this, the market was down slightly six months later. In line with election year seasonality. @NDR_Research pic.twitter.com/GvYmLiO1GZ
— Will Geisdorf (@wgeisdorf) December 19, 2019
Sentiment:
AAII Bulls finally at YTD highs – most since Sep 2018, Bears lowest since April.
Bull-Bear Spread getting stretched – top 7% of readings since 2009 and highest since Feb 2018. Can get more extreme but most cases led to a pullback (reminds me alot of late Dec 2013). pic.twitter.com/1q5hrru26J
— Macro Charts (@MacroCharts) December 19, 2019
One year ago, the "dumb money" was never more confident in more losses.
Today, they're the 2nd-most confident in more gains.
If you were panic selling a year ago, and panic buying now, you have a lot of friends. pic.twitter.com/5F8vE1Nd86
— SentimenTrader (@sentimentrader) December 19, 2019
The gap between U.S. 2 & 10-year yields is now the widest since November 2018. pic.twitter.com/vAGjVF6x4k
— Lisa Abramowicz (@lisaabramowicz1) December 19, 2019
The $61 level has been really important for #oil this year. Price is retesting now, along with falling resistance from the Apr and Sept peaks, and resistance from the rising channel begun in late Sept. $USO $WTI $CL $XOP $XLE pic.twitter.com/qYREB0nMoB
— Tarek I. Saab (@FibLines) December 19, 2019
don't get freaked out tomorrow morning when you see $SPY rolling across the screen premkt and see it down $1.50
tomorrow $SPY and all the SPDR ETFs (ie $XLF $XLV $XLE $XRT) go ex div tomorrow, they always do on quadruple witching day pic.twitter.com/fPkHrR404C
— Christian Fromhertz (@cfromhertz) December 19, 2019
"Mark my words, if Trump is impeached and Brexit finally wins, then the stock market will quietly rally to several new highs." research note Hindsight Capital Partners, LLC pic.twitter.com/YsOUo4jmVR
— Eddy Elfenbein (@EddyElfenbein) December 19, 2019
You’re all caught up now. Thanks for reading!