Sponsored By:

Today’s Summary
Friday, October 11th, 2019
Indices: US stocks ended the week on a positive note with the Dow Jones Industrial Average rallying 320 points or 1.21%. The Russell 2000 was the strongest of the major averages, jumping 1.79%.
Sectors: Materials led, gaining 1.94%. Utilities lagged for the second day in a row, slipping 0.37%.
Commodities: Crude Oil futures moved higher by 2.20% to $54.75 per barrel. Gold futures fell 0.81% to $1,489 per ounce.
Currencies: The US Dollar Index moved lower by 0.37%.
Interest Rates: The US 10-year Treasury yield rose to 1.732%.
Here are the best charts, articles, and ideas being shared on the web today!
Chart of the Day
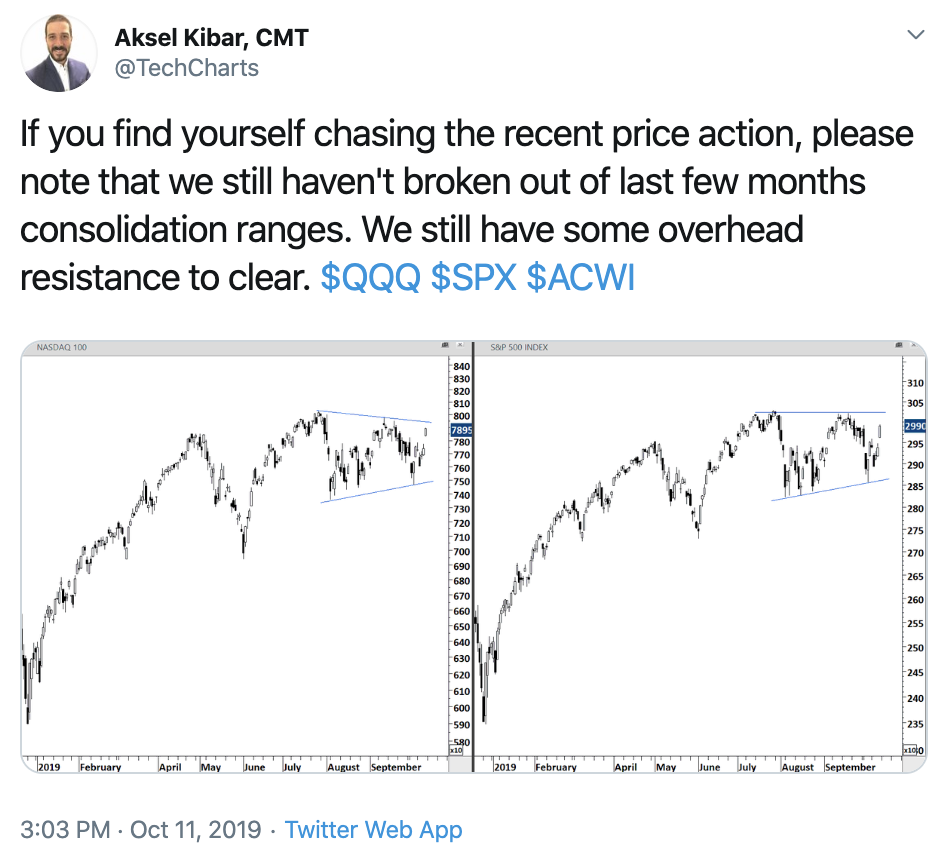
Today’s Chart of the Day was shared on Twitter by Aksel Kibar (@TechCharts). On the left is a daily candlestick chart of the Nasdaq 100 ($NDX). On the right is a daily candlestick chart of the S&P 500 ($SPX). Many bulls came out from hiding today after the market gapped higher this morning. However, Aksel emphasizes that the major averages still haven’t broken out of the consolidation ranges that they’ve been stuck in since July. This chart serves as an excellent reminder to stay focused on the bigger picture and that one day does not make a trend.
Quote of The Day
Top Links
Hitting the Seasonal Sweet Spot – Bespoke
Bespoke explains that we’re entering a bullish time of year for Stocks. According to their seasonality research, the market has a median gain of +1.50% over the next week, +2.66% over the next month, and +6.99% over the next three months.
$TLT Retesting Breakout and Trendline – Fibonacci.com
Tarek Saab of Fibonacci.com breaks down a chart of the 20+ Year Treasury Bond ETF, $TLT and lays out some key levels to watch.
Stocks to Watch Amid Market Volatility – Investor’s Business Daily
In this podcast, David Keller and Host, Irusha Peiris discuss David’s research process as well as the current market environment.
Martin Pring: Short-Term Indicators Behave Differently in Bull and Bear Markets – StockCharts.com
Martin Pring of StockCharts.com explores how technical indicators behave differently depending on the direction of the primary trend.
Stock Market Analysis – October 11th, 2019 – Brian Shannon
Here’s Brian Shannon’s weekly market video where he recaps this past week and gives his outlook for the week ahead.
Top 10 Tweets
1) While I kept hearing a couple weeks back that "stock looks horrible…" and "there are breakdowns…." the truth is many group have been strong. $ITB $XLU $XLP $IYR $SMH
and looking at the advance / decline line for NYSE stocks there was never a breakdown in overall breadth pic.twitter.com/Go0vGieb51
— Christian Fromhertz (@cfromhertz) October 11, 2019
$SMH breaking out relative to $SPX with mo shifting to bullish ranges. Increases the odds that $SPX will do the same. Dr. Semis? pic.twitter.com/MZNqgJMTco
— Dan Russo, CMT (@DanRusso_CMT) October 11, 2019
Your view on Semiconductors right now might depend on which index you are looking at (SMH vs $SOX), and by extension the relative importance of Taiwan Semiconductor (TSM is 14% of SMH and 4% of $SOX). pic.twitter.com/qTg8O2mEPn
— Willie Delwiche (@WillieDelwiche) October 11, 2019
$EEM / $SPY has tracked $XLE / $SPY for twenty years running. If causality exists, which is the dependent variable? pic.twitter.com/ZjLbv2M6Gn
— Mark Ungewitter (@mark_ungewitter) October 11, 2019
Dax – new multi week highs right into Europe close. A great pre-market indicator – follow the momo… pic.twitter.com/7fZKfY4lQJ
— Linda Raschke (@LindaRaschke) October 11, 2019
On the move! #GBP now up more than 3.5% against the #US Dollar during the last two trading days. #Brexit pic.twitter.com/NJecHKaV4e
— jeroen blokland (@jsblokland) October 11, 2019
$GBPUSD has surged as much as 4.1 percent over the past two days (to the high). This is the biggest 2-day rally since Nov 2008. If you use this as a quantitative qualifier, you could say 'this is the most optimistic Pound traders have been since the Brexit referendum' pic.twitter.com/6BIFieaoFy
— John Kicklighter (@JohnKicklighter) October 11, 2019
Hedge funds are long the Japanese Yen, but they are seriously overextended on the precious metals trade.
It seems to me Gold peaked with the recession worries reaching fever pitch levels. The commitment of traders data signals bulls are in for a shakeout. $GLD pic.twitter.com/l6ICLt5ZNo
— Tiho Brkan (@TihoBrkan) October 11, 2019
Gold $GLD vs. S&P 500 $SPY
nothing new here, but we’re coming close to violating the uptrend in the ratio pic.twitter.com/sHpyFyGOJq— Shane C. Murphy (@murphycharts) October 11, 2019
Hey! The yield curve un-inverted #TGIF https://t.co/XspZRcRsnP via @markets pic.twitter.com/tlodMRFGre
— Katherine Greifeld ? (@kgreifeld) October 11, 2019
Upcoming Events
Monday, October 14th – Dallas Chapter Meeting Featuring Jeffery Hirsch
Tuesday, October 15th – Minnesota Chapter Meeting Featuring Dave Keller, CMT
Tuesday, October 22nd – New York Chapter Meeting Featuring Sam Stovall
You’re all caught up now. Thanks for reading!