Sponsored By:

Today’s Summary
Thursday, October 3rd, 2019
Indices: US stocks closed higher in today’s session with the Dow Jones Industrial Average gaining 122 points or 0.47%. The Nasdaq was the strongest of the major indices, advancing 1.12%.
Sectors: All 11 sectors were positive. Technology led, gaining 1.23%. Utilities lagged but still closed higher by 0.24%.
Commodities: Crude Oil futures slipped 0.28% to $52.49 per barrel. Gold futures rose 0.41% to $1,514 per ounce.
Currencies: The US Dollar Index inched lower 0.10%.
Interest Rates: The US 10-year Treasury yield fell to 1.534%.
Here are the best charts, articles, and ideas being shared on the web today!
Chart of the Day
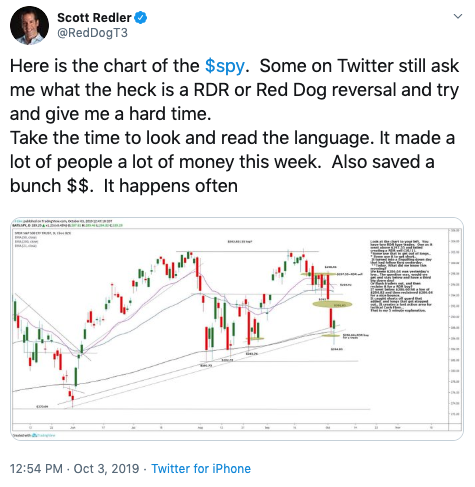
Today’s Chart of the Day was shared on Twitter by Scott Redler (@RedDogT3). It’s a daily candlestick chart of the S&P 500 ETF, $SPY. Scott uses this chart to highlight a “Red Dog Reversal” pattern. The first example is the candle from October 1st, where price broke out to a 4-day high but then quickly reversed lower. As you can see, this reversal was followed by a gap lower yesterday and a big red candle. The second example is from today’s candle where price broke below yesterday’s low of $286.64, and the quickly reversed higher to reclaim the $286.64 level. Scott explains: “It caught shorts off guard that added, and longs that got stopped out. It creates a fast action area for tactical Cash Flow.” It’ll be interesting to see if today’s reversal will follow through to the upside tomorrow.
Quote of The Day
Top Links
Have a Little More Pain Left in October: Stock Trader’s Almanac’s Hirsch – CNBC
Seasonality Expert, Jeff Hirsch made an appearance on CNBC this afternoon to talk about “Octoberphobia.”
Discussing Equities, Volatility & Tariffs on TD Ameritrade Network – Thrasher Analytics
Technical Analyst and Volatility Expert, Andrew Thrasher shares his thoughts on the latest dip in Equity Markets.
Did the Market Bottom or Bounce? – Market Gauge
In this quick read, Michele Schneider lays out some key levels and industry groups to keep an eye on.
S&P 500 Could Drop to 2,100 in First Quarter, ICAP’s Walter Zimmermann – Bloomberg
Walter Zimmermann of ICAP Technical Analysis examines the bearish rising wedge pattern on the S&P 500.
Maintaining Perspective as We Navigate a Noisey Start to Q4 – RW Baird
Here’s a note from Baird discussing the current market environment, including commentary on Volatility, Semiconductors, Copper, Gold, and Bond Yields.
Top 10 Tweets
Even with this week's selloff, stocks still the best bet since Dec 2018 market low.$SPX $SPY $USO $GLD $TLT pic.twitter.com/kbyRNzEXfy
— David Keller, CMT (@DKellerCMT) October 3, 2019
Not very much volume resistance above us here ??$SPY $SPX pic.twitter.com/TE7s3ez23x
— David Settle, CMT (@davidsettle42) October 3, 2019
CURRENT PRICE ACTION $ES_F and outlook ahead pic.twitter.com/cDGPKfkAgM
— Anne-Marie Baiynd (@AnneMarieTrades) October 3, 2019
$IWM $RUT Small caps testing the bottom end of its YTD range! pic.twitter.com/qSThZSPySQ
— Robert Lesnicki (@Robertlesnicki) October 3, 2019
$SOXX is holding up pretty well considering. The ETF backed off its July high, which was a 52-week high, but remains well above the August low. It is currently near the 61.8% retracement for the third time this year with a bull flag taking shape. Wait for the break though. pic.twitter.com/OmxrNiBE7T
— Arthur Hill, CMT (@ArthurHill) October 3, 2019
2's/10's 2 month high pic.twitter.com/FKVR5qXvk8
— Tom Hearden (@followtheh) October 3, 2019
Cool chart. 10-year yield in red. The other line is High Beta divided by the S&P 500. cc @TheStalwart @michaelsantoli pic.twitter.com/kfMdYbvY0c
— Eddy Elfenbein (@EddyElfenbein) October 3, 2019
$NKE holding strong and looking good as long as highlighted breakout level holds pic.twitter.com/WYtyVAz6aA
— Gregory Krupinski (@G_krupins) October 3, 2019
Price will usually "hug" the strong resistance/support before a major breakout takes place. This shows buyers willingness. pic.twitter.com/xtyKq6JMV8
— Aksel Kibar, CMT (@TechCharts) October 3, 2019
With 4 weeks til #Halloween2019, we started wondering if seasonality impacts stock performance of candy companies.
Turns out, the correlation isn't very spooky. ??$HSY $MDLZ $TR $NRSGY pic.twitter.com/vNGGr7XNRM
— YCharts (@ycharts) October 3, 2019
Upcoming Events
Thursday, October 3rd – CMT Association New York Chapter Meeting Featuring Todd Sohn, CMT
Thursday, October 3rd – Atlanta Chapter Meeting Featuring Katie Stockton, CMT
Sunday, October 6th – A Look At The Markets Into Next Week Using TrendSpider w/ Guest Patrick Dunuwila from “The Chart Report”
Wednesday, October 9th – Webcast: “The Market Between Now And Year-End” with Ralph Acampora, CMT
You’re all caught up now. Thanks for reading!