Sponsored By:
![]()
Today’s Summary
Wednesday, September 4th, 2019
Indices: US stocks were higher in today’s session with the Dow Jones Industrial Average closing up 237 points or 0.91%. The Nasdaq was the strongest of the major indices, climbing 1.30%.
Sectors: All 11 sectors of the S&P 500 advanced. Communications led, gaining 1.94%. Health Care lagged, but eked out a small gain of 0.07%.
Commodities: Crude Oil futures jumped 4.27% to $56.21 per barrel. Gold futures rose 0.30% to a new multi-year high of $1,560 per ounce.
Currencies: The US Dollar Index fell 0.55%.
Interest Rates: The US 10-year Treasury yield rose to 1.471%.
Here are the best charts, articles, and ideas being shared on the web today!
Chart of the Day
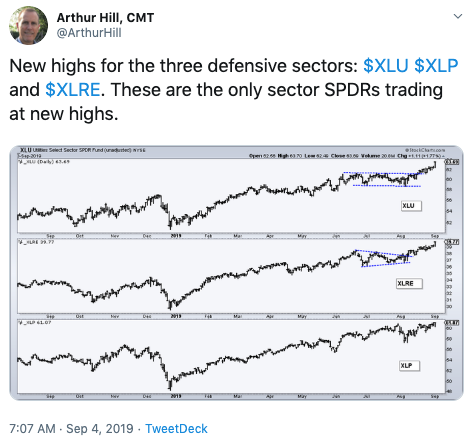
Today’s Chart of the Day was shared on Twitter by Arthur Hill (@ArthurHill). The chart shows the three defensive sectors of the S&P 500; Utilities, Real Estate, and Consumer Staples. Arthur points out that all three of these sectors are currently at all-time highs. This flight to safety has been going on for the majority of 2019. We’ve written several pieces on what we call “the safety trade”. Leadership from these three defensive sectors is typically a bearish sign, as these are some of the “safer” areas of the market. However, many argue that investors are piling into these sectors in search of yield and that the safety trade is really a result of historically low-interest rates.
Quote of The Day
Top Links
Good Riddance to August, but September Could be Just as Bumpy for Stocks, History Shows – USA Today
Here’s an article from USA Today that examines stock market seasonality in September, featuring thoughts from notable Technicians like Ryan Detrick.
Multi-decade Breakout? Or Another False Start? – All Star Charts
JC Parets of All Star Charts breaks down a chart of the Value Line Geometric Index. This serves as a broad measure of the market and it’s currently sitting at a key inflection point.
Down August, Up YTD, No Worries – Almanac Trader
Seasonality Expert Jeff Hirsch points out that September is historically the worst-performing month. However, he found that September returns tend to be positive in years when the market is up YTD but down in August (like in 2019).
Utilities (XLU) Still on the Up and Up – Bespoke
Bespoke takes a look at the Utilities sector ($XLU). They explain that it can continue higher despite being extremely overbought.
Investors Are Too Pessimistic About the S&P 500, BofA Merrill’s Suttmeier Says – Bloomberg
Technical Strategist at Bank of America Merrill Lynch, Steve Suttmeier joined host Abigail Doolittle to discuss market sentiment and what the put/call ratio could be suggesting for the S&P 500.
Top 10 Tweets
Should be a little interesting. $SPY $SPX big day tomorrow. pic.twitter.com/fB6tY02WVa
— Sam McCallum (@honeystocks1) September 4, 2019
88% upside day. Ppl complaining about low vol but it was in the right places. Also was better than either of last week's 82%/83% back-to-back upside days. 2945 remains a *very* important level (this is a two-hour chart). pic.twitter.com/mY28H0ZulB
— Walter Deemer (@WalterDeemer) September 4, 2019
S&P 1% Moves over the Past Month.
Since 2009, Stocks formed a Major bottom virtually every time Volatility got this extended.
Even in 2007-2008, similar Volatility spikes led to sharp Bear market rallies along the way.$ES_F $SPX $SPY #Stocks pic.twitter.com/2maasMhGvG
— Macro Charts (@MacroCharts) September 4, 2019
Financial-sector watch. If December 2018 was a cyclical bottom (working hypothesis), $XLF should eventually post new highs. Hasn’t happened yet, but still behaving in normal, post-GFC fashion. pic.twitter.com/Aev8NoIpGU
— Mark Ungewitter (@mark_ungewitter) September 4, 2019
$SLV sweet baby jesus pic.twitter.com/TaJ0GhwTD8
— TradeTheTrader (@TradeTraders) September 4, 2019
2011 drop in yields while crude maintained a bid looks very similar to current day. Could yields follow pattern of new lows with RSI divergence while crude maintains as deflationary threat recedes? pic.twitter.com/hmHm2P5NFg
— Todd Gordon (@toddgordontrade) September 4, 2019
In the ballpark of an extreme here… some 93 days with the 10-year yield below its 50-day moving average. Chart via @verrone_chris @Todd_Sohn pic.twitter.com/FssAqn5J0H
— Strategas (@StrategasRP) September 4, 2019
Letting the technicals speak for themselves $CPB pic.twitter.com/ddq96QG6ni
— Michael Kahn, CMT (@mnkahn) August 30, 2019
Can doggiest of dogs catch a bid? technical wedge on both dailies and weeklies. Lead a dog to water, but will it drink? pic.twitter.com/IYd9B2J06o
— Linda Raschke (@LindaRaschke) September 4, 2019
I'm working on becoming an abstract artist.
I call this one 'The Millennial'$XRP $OSTK $CGC pic.twitter.com/HDygfPieEC
— Arun S. Chopra CFA CMT? (@FusionptCapital) September 4, 2019
You’re all caught up now. Thanks for reading!