Sponsored By:
![]()
Today’s Summary
Thursday, August 29th, 2019
Indices: US stocks were higher in today’s session with the Dow Jones Industrial Average gaining 326 points or 1.25%. The Russell 2000 was the strongest of the major indices for the second day in a row, rising 1.63%.
Sectors: All 11 sectors of the S&P 500 closed higher. Technology led, gaining 1.74%. Consumer Staples lagged but managed to eke out a small gain of 0.05%.
Commodities: Crude Oil futures were up 1.63% to $56.67 per barrel. Gold futures fell 0.77% to $1,537 per ounce.
Currencies: The US Dollar Index gained 0.23%.
Interest Rates: The US 10-year Treasury yield moved higher to 1.496%.
Here are the best charts, articles, and ideas being shared on the web today!
Chart of the Day
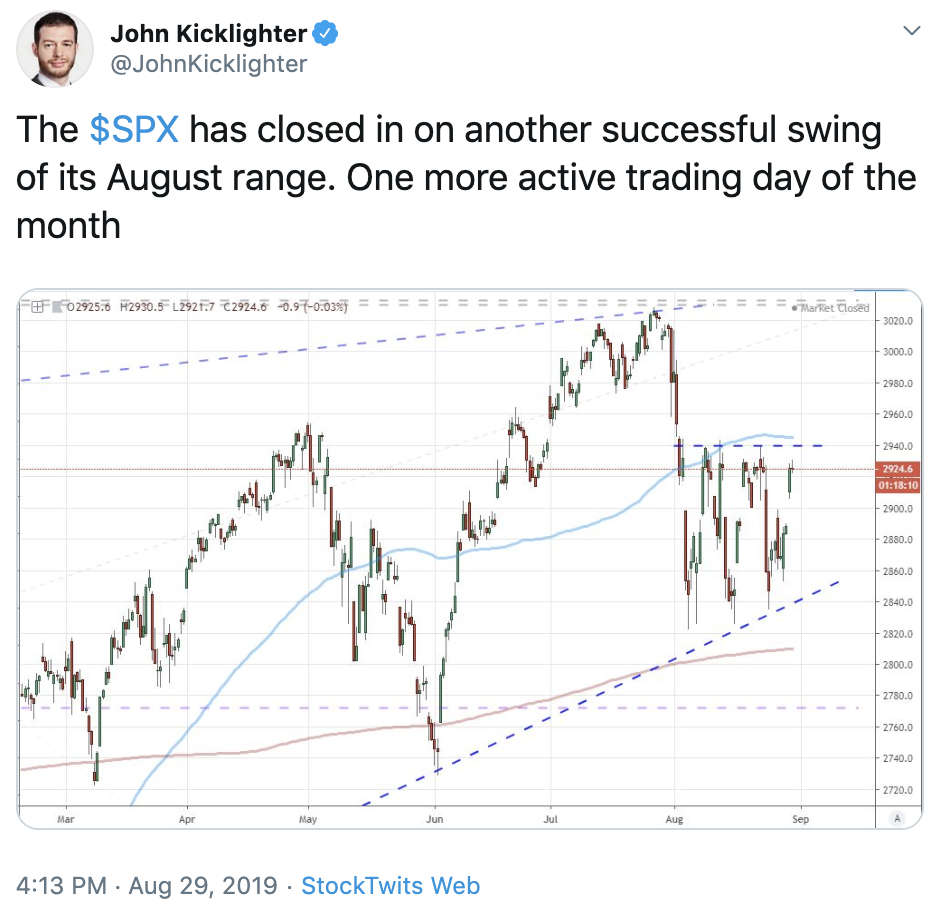
Today’s Chart of the Day was shared on Twitter by John Kicklighter (@JohnKicklighter). It’s a four-hour candlestick chart of the S&P 500 index going back to February of this year. For the majority of August, the index has been stuck in a choppy trading range. John notes that the index is currently testing the upper end of this range. This is actually pretty typical price action for the month of August as it’s a notoriously volatile and lackluster month for stock returns. Tight consolidations like this often resolve in an explosive move higher or lower. This will be the fourth time in the past few weeks that price has tested the upper end of this range. Will the fourth time be the charm, or does the index run into resistance at this level and head back to the bottom of the range? We could find out the answer to this question as soon as tomorrow!
Quote of The Day
“Risk is good. Not properly managing your risk is a dangerous leap.”
– Evel Knievel (Stunt Performer )
Top Links
The Big BAANG – The Chart Report
A few weeks ago, John Roque went on CNBC to propose a group of Gold Mining stocks that he thinks will outperform the beloved FAANG stocks. In this report, we check up on this group and see how its performed versus FAANG.
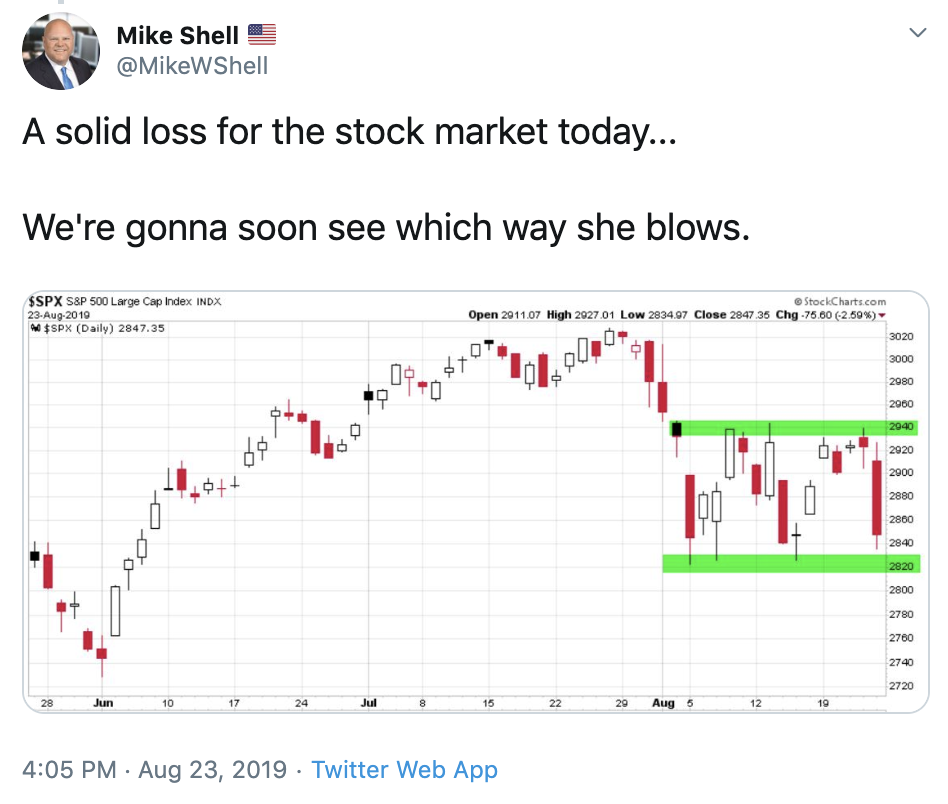
The Stock Market is in a Period of Indecision That it Will Break Out of – Asymmetry Observations
Portfolio Manager, Mike Shell takes a look at the tight trading range that the market has been in during the month of August and offers his thoughts on what’s going to happen next.
Thursday’s Key Levels for Indicies and Sectors – Market Gauge
Michele Schneider highlights some of the important levels to watch on the major averages as well as some of the popular industry group ETFs.
The Gold Rally May Cool Briefly – Bloomberg
Bloomberg’s Greg Bender and Abigail Doolittle discuss Gold and what options action is signaling for the Precious Metal.
The One “Technology” Sector Not Working – All Star Charts
Tom Bruni of All Star Charts examines the chart of Biogen ($BIIB) as well as the Biotechnology industry group ETF, $IBB.
Top 10 Tweets
Hey cool the market's up a bunch today! Maybe $SPX isn't in that range anymore!
*checks chart*
Nope, still in a range.
— Andrew Thrasher, CMT (@AndrewThrasher) August 29, 2019
How have stocks done under each President is always a popular question.
Here are the results from the start of the Dow in 1896. pic.twitter.com/w3fzBZqGDp
— Ryan Detrick, CMT (@RyanDetrick) August 29, 2019
$IWM holds support again but the MAs and Volume set up for some solid resistance in the $151 – $155 zone. pic.twitter.com/M2OdWWcoyM
— Dan Russo, CMT (@DanRusso_CMT) August 29, 2019
Largest spread between Bullish and Bearish sentiment since December continues to linger. It makes you wonder who is submitting surveys during the last month of summer… $SPY $STUDY #AAII pic.twitter.com/s7e7DvsW45
— Matthew Timpane, CMT (@offbeatoperator) August 29, 2019
Just because $SPX hasn't sold off during this extreme flight to safety doesn't stocks haven't sold off. Here's the returns since January 26, 2018 for ETFs tracking stocks in the world's 12 largest economies, including $SPY$FXI $EWJ $EWG $EWU $EWQ $EPI $EWI $EWZ $EWC $RSX $EWY pic.twitter.com/5gpBFshPkc
— David Settle, CMT (@davidsettle42) August 29, 2019
Sentiment:
AAII Investor Sentiment Bulls 4wk average at 24.40.
Among the lowest in more than three decades of this survey.
Significantly lower than December 2018 when Stocks last formed a major bottom.
Just barely above the March 2009 low of 23.13.$ES_F $SPX $SPY #Stocks pic.twitter.com/9so8ySrrd0
— Macro Charts (@MacroCharts) August 29, 2019
Treasury bonds have steadily been outperforming U.S equities since October on a relative basis. Watch to see if we finally see a breakout on the ratio chart or pullback similar to the start of the year. $TLT $SPY pic.twitter.com/g6jIbW4MdG
— Mitchell Warren (@MitchellKWarren) August 29, 2019
$AMZN is bouncing off a support zone (broken resistance, June low and 200-day). RSI moved from oversold levels in early August as well. Stock accounts for 21.67% of $XLY. pic.twitter.com/b3hiNjOyPT
— Arthur Hill, CMT (@ArthurHill) August 29, 2019
MCD _ won't take much to make another all-time new high pic.twitter.com/DY3FuTrUxu
— Linda Raschke (@LindaRaschke) August 29, 2019
I see you, Copper ? pic.twitter.com/ztdY79odGa
— David Zarling (@360research) August 29, 2019
You’re all caught up now. Thanks for reading!