Sponsored By:
![]()
Today’s Summary
Tuesday, August 20th, 2019
Indices: US stocks were lower in today’s session with the Dow Jones Industrial Average closing down 173 points or 0.66%. The S&P 500 was the weakest of the major indices, falling 0.79%.
Sectors: 10 out of the 11 sectors of the S&P 500 closed lower. Consumer Discretionary led, gaining only 0.03%. Financials lagged, falling 1.34%.
Commodities: Crude Oil futures were relatively flat, moving just 0.11% to $56.11 per barrel. Gold futures rose 0.28% to $1,516 per ounce.
Currencies: The US Dollar Index fell 0.20%.
Interest Rates: The US 10-year Treasury yield moved lower to 1.552%.
Here are the best charts, articles, and ideas being shared on the web today!
Chart of the Day
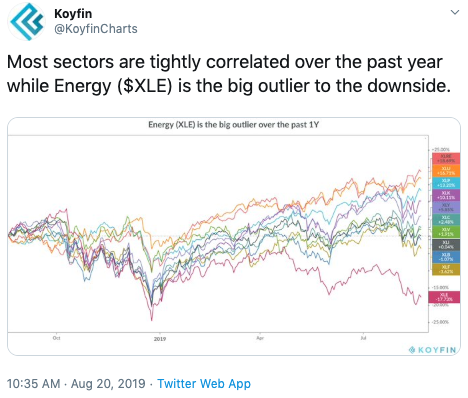
Today’s Chart of the Day was shared on Twitter by Koyfin (@KoyfinCharts). It is a performance chart of the 11 sectors of the S&P 500 over the past 12 months. Koyfin notes that the Energy Sector “is the big outlier to the downside.” The Energy sector ETF, $XLE is down 17.74% while the S&P 500 is up 1.79%. This is likely due to the weakness in Crude Oil which has fallen nearly 15% over the same period. Even the Financial Sector, (second worst-performer) has fared significantly better than Energy. It’ll be interesting to keep an eye on this relationship going forward to see if Energy will catch-up to the rest of the pack.
Quote of The Day
Top Links
Range-Bound – The Chart Report
In this report, we highlight what some of the top-technicians are saying about the trading range that the S&P 500 is currently stuck in.
Are You Pinning Your Hopes on This Stock? – StockCharts.com
This piece from Greg Schnell of StockCharts takes a look at one IPO stock that’s attempting to break out to all-time highs, Pinterest ($PINS).
When Will Small-Caps Start to Outperform? – All Star Charts
In this clip, JC Parets and The Chart Report’s Steve Strazza discuss the weakness of Small-caps Stocks.
Hard to See a Rally in Transports Going Forward, Says Investing Pro – CNBC
Head of Technical Analysis at Oppenheimer, Ari Wald weighs in on the Dow Jones Transportation Average and Dow Theory.
Second Half August Trading: Historically Weak Too – Almanac Trader
Here’s a quick read from Seasonality Expert, Jeff Hirsch. He points out that historically, the back half of August tends to be weak for US Stocks.
Top 10 Tweets
$SPX is in a short-term range. Until it breaks out, patience is your friend. pic.twitter.com/XRrbwlutil
— Andrew Thrasher, CMT (@AndrewThrasher) August 20, 2019
BAYCREST: “We have minimal short-term directional conviction ..”
(via @jkrinskypga) pic.twitter.com/MtUR3drs11
— Carl Quintanilla (@carlquintanilla) August 20, 2019
Bulls: As they say, 5th time's the charm
Bears: Your team is behind 3 to 4. Need to score soon$spx pic.twitter.com/JJqg4gn86c— Urban Carmel (@ukarlewitz) August 20, 2019
After flushing stops below the June low, $IWM has bounced up to the declining 200DMA and VWAP from the Dec 18 low. To me, it is just a mess to avoid unless you want to get into intraday timeframes pic.twitter.com/BhBYjfhlQx
— Brian Shannon, CMT (@alphatrends) August 20, 2019
R/S at a new four-month low. pic.twitter.com/GROZ3LkGYS
— Walter Deemer (@WalterDeemer) August 20, 2019
The stock market is up about 3% since mentions of the word "recession" in the media spiked to a multi-year high. Fascinating.. pic.twitter.com/40pcMGo1Li
— Eric Balchunas (@EricBalchunas) August 20, 2019
The Momentum Index is holding up relatively well isn't it? $MTUM pic.twitter.com/s0mtenUwpP
— J.C. Parets (@allstarcharts) August 20, 2019
Broad trade-weighted dollar has taken out its 2002 high … will weigh on economy (especially exporters) & corporate profitability pic.twitter.com/qwR84lMgjH
— Liz Ann Sonders (@LizAnnSonders) August 20, 2019
Well done, well f*cking done. pic.twitter.com/3SaTRWuSVK
— Arun S. Chopra CFA CMT? (@FusionptCapital) August 20, 2019
If you put $10,000 into JC Penney in February 2007, you have $72 pic.twitter.com/PjHUCxtYxI
— Michael Batnick (@michaelbatnick) August 20, 2019
You’re all caught up now. Thanks for reading!