Sponsored By:
![]()
Today’s Summary
Friday, August 9th, 2019
Indices: US stocks closed lower in today’s session with the Dow Jones Industrial Average falling 91 points or 0.34%. The Nasdaq was the weakest of the major indices, dropping 1.00%.
Sectors: Health Care led, gaining 0.12%. Technology lagged, falling 1.13%.
Commodities: Crude Oil futures rose 3.61% to $54.48 per barrel. Gold futures were flat but continue to trade above the $1,500 level at $1,509 per ounce.
Currencies: The US Dollar Index was lower by 0.60%.
Interest Rates: The US 10-year Treasury yield rose to 1.733%.
Here are the best charts, articles, and ideas being shared on the web today!
Chart of the Day
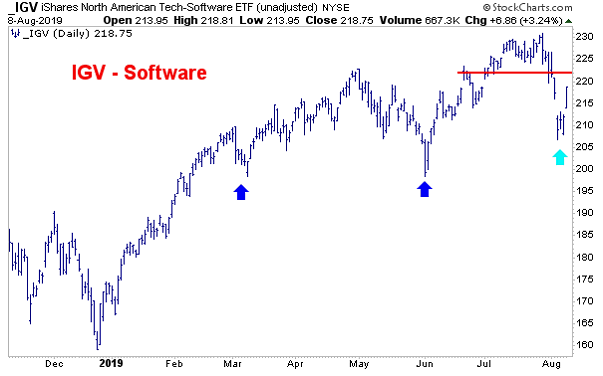
Today’s Chart of the Day was shared in a research note by Frank Capelleri of Instinet (@FrankCappelleri). It’s a daily bar chart of the iShares software ETF, $IGV. In the note, Frank explains that Technology is a heavily weighted component in all the major indices and says “the major indices will live or die by its performance.” Within Technology, Software has been the clear leader. Yesterday, the Software ETF was up over 3%, a sign that investors were eager to jump back into risk-on areas of the market. Frank adds that “investors couldn’t get back in fast enough yesterday.” Continued strength from the Software ETF would be bullish for the Technology sector as well as the broader market.
Quote of The Day
Top Links
Getting Sentimental – The Chart Report
In this report, we take a look at the overwhelmingly bearish sentiment in the market right now. We discuss the fact that sentiment is often a contrarian indicator, as markets tend to move against the crowd.
Getting Technical: The Next Generation – It’s Not Gold That’s Getting Me Nervous – Michael Kahn
Technical Analyst, Michael Kahn does a deep dive into the Precious Metals rally. He examines several charts including Gold, Silver, Platinum, and Copper.
Technicals Support the Market – LPL Financial Research
LPL Financial Research points out that the S&P 500 held above the June lows while the 5-day put/call ratio surged to its highest level since December 2018. They view both of these technical developments as bullish for the broader market.
The Macro Levels That Matter Most – Real Vision
John Kolovos of Macro Risk Advisors made an appearance on Real Vision today to share what he thinks the technicals are suggesting for the current Macro-environment.
Why Everybody Turned ‘End of the World Bearish’ This Week – Yahoo Finance
Here’s a great read that Joe Fahmy wrote for Yahoo Finance. In the article, he explains why investor sentiment was a big driver of this week’s volatility.
Top 10 Tweets
The NAAIM exposure survey has has a huge drop of in active managers who say they are bullish. Last week, it was 91%. This week? 56% pic.twitter.com/oXftskXoj5
— Dani Burger (@daniburgz) August 9, 2019
Latest AAII Sentiment levels swings 41% in one week from Bullish to Bearish – largest swing since April 2013. Now 48% bearish vs 21.5% Bullish: pic.twitter.com/IobtKN8RL2
— Optuma (@Optuma) August 9, 2019
The Energy ETF:S&P 500 ETF ratio chart (relative strength in energy stocks vs the S&P 500) is near the lows last seen since 2000. $XLE $SPY pic.twitter.com/yLhFcoIsdg
— Mitchell Warren (@MitchellKWarren) August 9, 2019
now what? $TLT pic.twitter.com/AVM2n6lqOu
— J.C. Parets (@allstarcharts) August 9, 2019
The gap between 2-year & 10-year U.S. yields is now at a post-crisis low, with less than a tenth of a percentage point separating the two. pic.twitter.com/algk08FICo
— Lisa Abramowicz (@lisaabramowicz1) August 9, 2019
$gld chart as we see if the upper gap holds or neees to retrace a bit pic.twitter.com/rfLWbPrvvE
— Scott Redler (@RedDogT3) August 9, 2019
I would call net speculative futures positioning in gold 'extreme', but that doesn't mean its going to top out. Devaluing all of the major fiat currencies is a powerful motivation to keep a trend going… pic.twitter.com/TjTvvDUOnl
— John Kicklighter (@JohnKicklighter) August 9, 2019
Commitments of Traders (CoT) data shows #gold futures positioning dangerously close to July 2016 extremes. Open interest > 600k contracts, large specs near 300k contracts net length, and commercials net short 324,325 contracts (3rd highest commercial short ever after July 2016). pic.twitter.com/c3kmkataXd
— CEO Technician (@CEOTechnician) August 9, 2019
Shanghai Composite vs. S&P 500: How low can it go? $SSEC $SPX pic.twitter.com/6SzHGQYNHS
— Mark Ungewitter (@mark_ungewitter) August 9, 2019
I feel like we've gone over this before.
Have a good weekend.
Also turn off the TV.$SPY $AMZN $MSFT pic.twitter.com/eDUFa5KRkM
— Arun S. Chopra CFA CMT? (@FusionptCapital) August 9, 2019
Upcoming Events
August 12th-18th – Chart Pattern Beauty Competition – Post your best chart to Twitter using the hashtag: #TrendSpiderContest19 to win a $100 Amazon Gift Card and more! Click here for details.
You’re all caught up now. Thanks for reading!