Sponsored By:
![]()
Today’s Summary
Wednesday, August 7th, 2019
Indices: US stocks were able to close flat in today’s wild session. The Dow Jones Industrial Average closed down just 22 points or 0.09% after being down as much as 589 points this morning. The S&P 500 and Nasdaq gained 0.08% and 0.38%, respectively.
Sectors: Materials led, gaining 1.35%. Financials lagged, falling 1.29%.
Commodities: Crude Oil futures dropped 4.61% to $51.14 per barrel. Gold futures surged 2.28% to the highest level since 2013 at $1,518 per ounce.
Currencies: The US Dollar Index was unchanged.
Interest Rates: The US 10-year Treasury yield fell to a multi-year low of 1.721%.
Here are the best charts, articles, and ideas being shared on the web today!
Chart of the Day
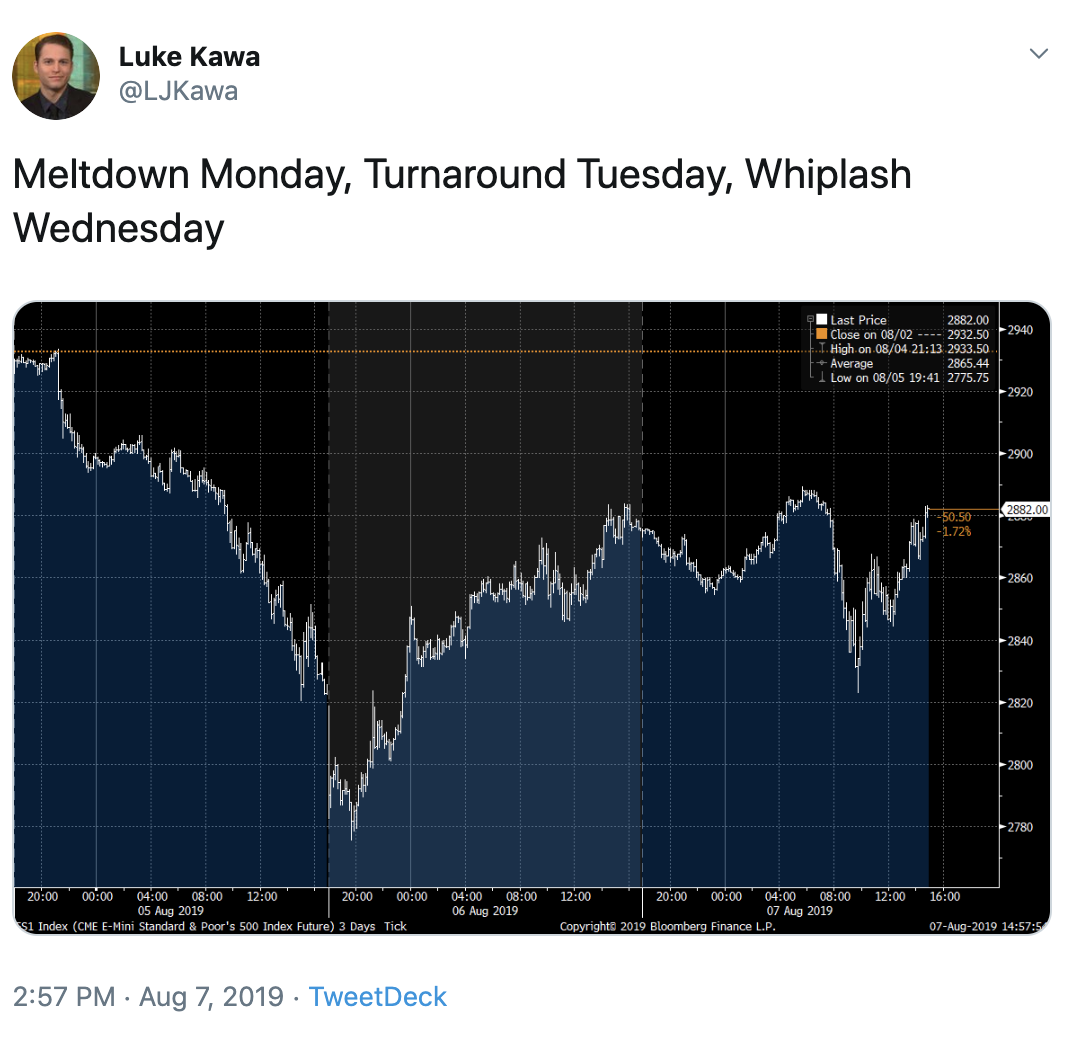
Today’s Chart of the Day was shared on Twitter by Luke Kawa of Bloomberg (@LJKawa). It is a chart of the S&P 500 futures this week. Luke cleverly sums up this week’s price action as Meltdown Monday, Turnaround Tuesday and Whiplash Wednesday. Monday we saw the S&P 500 drop by nearly 3%. Tuesday the index rebounded about 1.30%. Today, (Wednesday) the index went from being down as much as 1.95% to closing higher on the day by 0.08%. This chart speaks to the rollercoaster ride that US investors have experienced so far this week. In the comments of his tweet, Luke jokes that he’s“praying for a Tranquil Thursday and Flat Friday.”
Quote of The Day
Top Links
US Treasury Yields Press Record Lows – The Chart Report
In this week’s Chart of the Week column, we examine the carnage that’s been going on in Global Interest Rates. The US 10-year yield is testing multi-year lows, while several other countries 10-year yields have slipped into negative territory.
Treasury Rally is Overdone and Gold May Drop Below $1,400, Hedge Fund Telemetry’s Thorton Says – Bloomberg
Tom Thorton of Hedge Fund Telemetry made an appearance on Bloomberg’s “Charting Futures” segment today to lay out his bearish outlook on Gold and Treasury Bonds.
Have Volatility Expectations Got Carried Away? – Dana Lyons
In this piece, Dana Lyons examines a ratio of the 1-month Volatility Index (VIX) to the 3-month Volatility Index (VXV). He argues that this ratio is signaling a good risk/reward buying opportunity for stocks.
Was the Recent Stock Market Top Just Another False Breakout? – BullMarkets.co
Troy Bombardia of Bull Markets.co points out that the US stock market has gone nowhere since January 2018. In addition to discussing the trend, he also touches on volume, breadth and the probability of a recession.
Putting the Sell-Off in Context – Real Vision
In this clip from Real Vision, Jessica Rabe of DataTrek Research puts Monday’s sell-off into historical perspective. She explains why a 3% move up or down is not abnormal and what tends to happen after a move of that magnitude.
Top 10 Tweets
Oh hey, look where we are again… pic.twitter.com/ODDICs1Eg3
— Michael Santoli (@michaelsantoli) August 7, 2019
$NDX ? pic.twitter.com/zpFmQ8JqP7
— Todd Harrison (@todd_harrison) August 7, 2019
Cool visual showing the distribution of daily stock returns over the past 10 years
Yesterday's big drop is highlighted on the left side.
(h/t @DataIsBeautiful) pic.twitter.com/6aZTU7VXyJ
— Nick Maggiulli (@dollarsanddata) August 6, 2019
Barring an overnight tweet, this doesn't look bearish, I must admit.$SPX $SPY pic.twitter.com/sfu5zDT0q0
— I. Vodenitcharov CFA CMT (@iv_technicals) August 7, 2019
Income-oriented investors can earn more from U.S. stock dividends than from yields on 10-year Treasuries for the first time since 2016. Chart by @TheOneDave via @TheTerminal pic.twitter.com/UkKR3PSgMt
— Lisa Abramowicz (@lisaabramowicz1) August 7, 2019
Both Long-term Treasuries & Gold are now outperforming the S&P 500 this year…$TLT: +19.2%$GLD: +17.3%$SPY: +14.3% pic.twitter.com/CFk1Xk2FuQ
— Charlie Bilello (@charliebilello) August 7, 2019
#Gold > USD 1500! First time since April 2013. pic.twitter.com/ACDr1Ntz2h
— jeroen blokland (@jsblokland) August 7, 2019
#GOLD $GOLD Gold / Copper pic.twitter.com/N9JOUFHc7i
— Nautilus Research (@NautilusCap) August 7, 2019
As gold breaks out above 1,500, the divergence from copper has become dramatic. Gold is now outperforming copper by more than 20% in the last 50 trading days.
Read more about today's price action in tonight's Closer: https://t.co/LXvoBrBOra pic.twitter.com/1RYwyJ8S6v— Bespoke (@bespokeinvest) August 7, 2019
Feels like the Death Flush of WTI crude oil is upon us… buckle up. pic.twitter.com/taMeIONGNg
— Raoul Pal (@RaoulGMI) August 6, 2019
Upcoming Events
Wednesday, August 7th – Webcast: “Making The Most Of Panic – Exploring The Value Of Combining Price & Supply/Demand Indicators” with Chris Diodato, CMT
August 12th-18th – Chart Pattern Beauty Competition – Post your best chart to Twitter using the hashtag: #TrendSpiderContest19 to win a $100 Amazon Gift Card and more! Click here for details.
You’re all caught up now. Thanks for reading!