Sponsored By:
![]()
Today’s Summary
Wednesday, July 31st, 2019
Indices: US stocks were lower in today’s session with the Dow Jones Industrial Average closing down 334 points or 1.23%. Both the S&P 500 and Nasdaq also dropped over 1%.
Sectors: All 11 sectors finished lower today. Energy led for the second day in a row but still fell 0.32%. Consumer Staples lagged, falling 2.03%.
Commodities: Crude Oil futures rose 0.93% to $58.52 per barrel. Gold futures fell 0.40% to settle at $1,431 per ounce.
Currencies: The US Dollar Index advanced 0.53% to a two-year high.
Interest Rates: The US 10-year Treasury yield sunk to 2.007%.
Here are the best charts, articles, and ideas being shared on the web today!
Chart of the Day
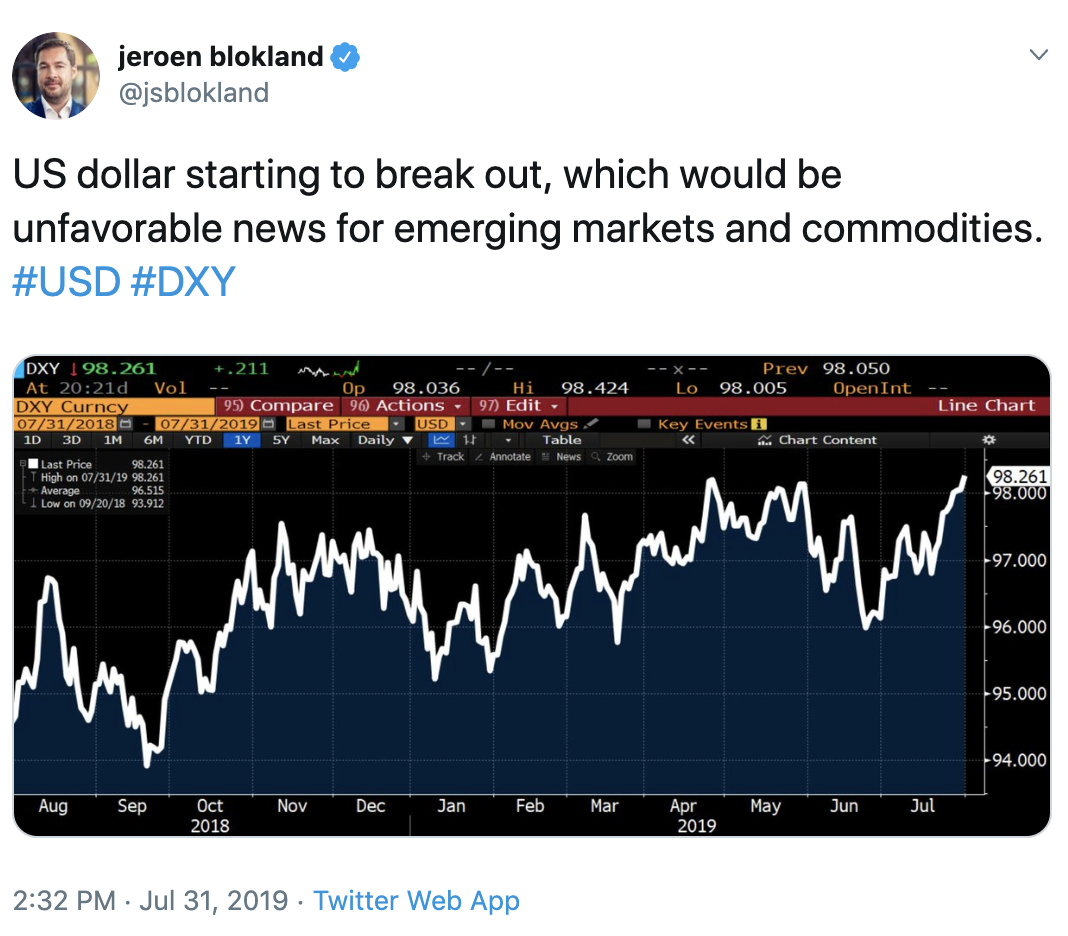
Today’s Chart of the Day was shared on Twitter by Jeroen Blokland (@jsblokland). It’s a chart of the US Dollar Index ($DXY) breaking out to a two-year high today after the Federal Reserve announced their decision to cut interest rates by 25 basis points. For those unfamiliar with the US Dollar Index, it’s used to measure the value of the US Dollar relative to a basket of the six major currencies (Euro, Swiss Franc, Japanese Yen, Canadian Dollar, British Pound, and Sweedish Krona.) Jeroen notes that if the Dollar continues to break out, it will likely put pressure on Emerging Markets and Commodity prices.
Quote of The Day
Top Links
What this Rare Small-Cap Signal Might Mean for Stocks – Schaeffer’s Investment Research
One thing keeping many Technicians cautious is the underperformance of Small-Cap stocks relative to their Large-Cap peers. In this piece, Schaeffer’s Investment Research argues that concerns over Small-Cap underperformance may be overblown.
The Fed, Treasury Yields, Housing, and a Bullish Continuation Pattern – StockCharts.com
In this piece, Arthur Hill examines the US Home Construction ETF, $ITB. He explains that the ETF has been forming a bullish continuation pattern known as an ascending triangle.
August’s First Trading Day Goes Splat – Almanac Trader
The first trading days of each month tend to be positive for the market however, Seasonality Expert Jeff Hirsch points out that August is an exception to this phenomenon.
Recapping Tony Dwyer’s CMT Presentation – All Star Charts
Canaccord Genuity’s Chief Market Strategist, Tony Dwyer presented to the New York Chapter of the CMT Association last week. Tom Bruni summarizes some of his key points in this blog post.
Here Comes August, Time to Buckle Up? – LPL Financial Research
With July coming to an end today, LPL Financial Research takes a look at how the month of August typically fares for the stock market.
Top 10 Tweets
The bears ended up taking a volatile day as the Fed issued an interest rate cut and had their fireside chat afterword.
All S&P 500 sectors were negative at the close with Staples, Materials, and Tech leading the way down. Gold dropped, NatGas surged. ☕️$SPY $GLD $UNG #stocks pic.twitter.com/tr5nmq8B2E
— Jack Damn (@JackDamn) July 31, 2019
S&P 240min chart since June shows the uptrend losing intensity of late-Stalling out into end of month, as breadth and momentum have waned a bit in the short run- Note MACD having made successively lower peaks since mid-June- $SPX $ES_F https://t.co/X2vMH2vVMN pic.twitter.com/Al92p7pKX2
— Mark Newton (@MarkNewtonCMT) July 31, 2019
probably different this time pic.twitter.com/SXfD3m0xue
— StockCats (@StockCats) July 31, 2019
XLF/SPY ratio peaked above trendline and pulled back. $XLF $SPY pic.twitter.com/lTV9WTZFGh
— Matthew Timpane, CMT (@offbeatoperator) July 31, 2019
How correlated is the relative strength between Regional Banks and Small Caps? Eerily similar, if I must say. pic.twitter.com/wO8yegUrLt
— Ian McMillan, CMT (@the_chart_life) July 31, 2019
Silver.
Call Volumes are at a new record, indicating extreme greed/euphoria in the options market, last seen 2011.
Add to the long list of extremes seen over the last two weeks.
Prior spikes led to very poor returns. Prices may already be stalling.$SI_F $SLV $XAG #Silver pic.twitter.com/07A27oDR8R
— Macro Charts (@MacroCharts) July 31, 2019
$UNG positive divergence. #natgas @enelyst_ @josh_vath pic.twitter.com/v2Ki6ykkkN
— Mike Zaccardi, CFA, CMT (@MikeZaccardi) July 31, 2019
Indian Nifty 50 Index Testing Post-2009 Up Trendline…Again #TrendlineWednesday $INDY pic.twitter.com/WI41CRisC1
— Dana Lyons (@JLyonsFundMgmt) July 31, 2019
$GBPUSD closed at lowest value in 132 weeks yesterday – since Jan 2017. Easy to calculate in a watchlist: https://t.co/pVeiXC6gt3 pic.twitter.com/HgMZqrxWhv
— Optuma (@Optuma) July 31, 2019
Here's Apple testing the high end of the rising channel from 2013 $AAPL pic.twitter.com/Y00d5cnjeX
— Aaron (@ATMcharts) July 31, 2019
Upcoming Events
Wednesday, August 7th – Webcast: “Making The Most Of Panic – Exploring The Value Of Combining Price & Supply/Demand Indicators” with Chris Diodato, CMT
You’re all caught up now. Thanks for reading!