Sponsored By:

Today’s Summary
Thursday, July 11th, 2019
Indices: US stocks were mostly higher in today’s session with the Dow Jones Industrial Average gaining 0.85% and closing above 27,000 for the first time ever! The S&P 500 also closed at an all-time high, while both the Nasdaq and Russell 2000 fell 0.08% and 0.46%, respectively.
Sectors: Industrials led, gaining 0.68%. Real Estate was the only sector to close negative, falling 1.28%.
Commodities: Crude Oil futures dipped 0.38% to $60.20 per barrel. Gold futures fell 0.35% to $1,408 per ounce.
Currencies: The US Dollar Index fell just 0.05%.
Interest Rates: The US 10-year Treasury yield ripped higher to 2.143%
Here are the best charts, articles, and ideas being shared on the web today!
Chart of the Day
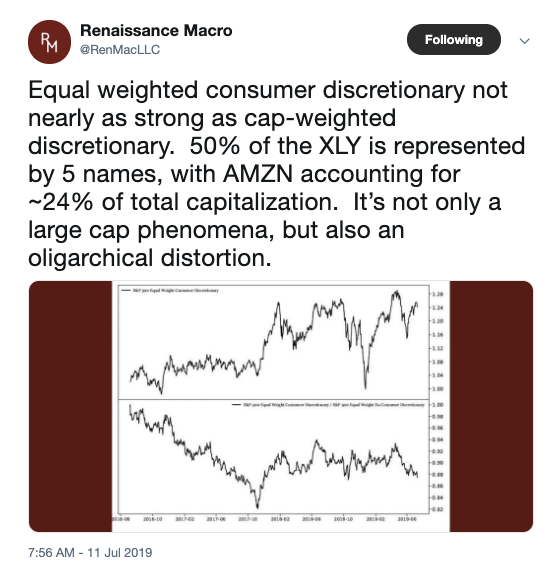
Today’s chart of the day was shared on Twitter by Renaissance Macro (@RenMacLLC). It’s a chart of an equally-weighted Consumer Discretionary index. The cap-weighted version of Consumer Discretionary, $XLY closed at an all-time high today, while the equally weighted version is far from reaching new highs. This shows us that it’s only a handful of the largest Consumer Discretionary names that are doing most of the heavy lifting. As they note, five stocks account for 50% of $XLY (Amazon, Home Depot, McDonald’s, Nike, and Starbucks). An equally-weighted view provides a less “distorted” view of the sector in this particular case, because of how skewed the cap-weighted version is to large-cap stocks like Amazon. The purpose of comparing cap-weighted to an equally-weighted version of the same group is to gauge the breadth of participation from the individual components.
Quote of The Day
“The most bullish thing a market can do is go up.”
– Paul Montgomery (Technical Analyst)
Top Links
Bank of America’s Chief Technical Strategist, Steve Suttmeier and Abigail Doolittle discuss what the charts are suggesting for the S&P 500. He also shares his thoughts on the Utilities and Financials.
More Upside for European Equities? – Real Vision
Guy Cerundolo of Cerundolo Investment Research was featured on Real Vision today to outline a bullish trade idea on the German DAX and the French CAC 40.
Reality Proves Sloppier Than Textbook Ideals – R.W. Baird
In this research note, Baird Investment Strategist, Willie Delwiche checks up on sentiment and breadth of the US stock market.
Large-Cap Indices at New Highs, Broader Market Lagging – Hedgopia
This article from Hedgeopia examines the ongoing divergence between large-cap indices and some of the smaller-cap indices such as the Russell 2000 and the Dow Transports.
Let’s Talk About Pullbacks and Corrections – LPL Financial Research
In this note from LPL Financial Research, they argue that the S&P 500 is due for a pullback or correction. They point out that since 1950, the S&P 500 has averaged three separate 5% pullbacks per year. This year, we’ve only had one.
Top 10 Tweets
Breadth isn't perfect and there will always be reasons why the rally isn't "ideal", but if the Russell 1000 Growth Index is above 157, our bias has to be to the upside.
Don't love the setup in the major indexes? There are individual names offering attractive reward/risk opps. pic.twitter.com/L33VKKBL4x
— Tom Bruni, CMT (@BruniCharting) July 11, 2019
Your Market Recap…
S&P 500: All-Time High close
Dow: All-Time High close
Nasdaq 100: All-Time High intra-day
Fed: Market pricing in 100% probability of a rate cut on July 31. pic.twitter.com/pCgj7ub4OZ— Charlie Bilello (@charliebilello) July 11, 2019
$ES_F 15m chart. Resistance is the price level you run out of buyers at. This concept is well demonstrated with this chart. pic.twitter.com/jpZmBE4rRm
— Yuriy Matso (@yuriymatso) July 11, 2019
The cannabis space has been extremely disappointing so far in 2019. Endless secondaries and suspect management (see: $CTST) are weighing on this sector. The cannabis ETF $MJ reflects this as it continues to move in a down channel. ? pic.twitter.com/OfTAogGDOF
— Brian Lund (@bclund) July 11, 2019
$VVIX is looking perky ?
But don't start drawing trendlines on it please. Just don't. pic.twitter.com/iGBIg3mFLb
— I. Vodenitcharov CFA CMT (@iv_technicals) July 11, 2019
$AMZN back over 2k! Just missed closing above $1T Market Cap along side $MSFT.
Since X-Mas Eve, $AMZN has gained over +50% pic.twitter.com/YGuDj76FQ8
— Rich Meatto (@koyfinTrader) July 11, 2019
$DIS does anyone see it differently? pic.twitter.com/4D9yTZnBGj
— Sam McCallum (@honeystocks1) July 11, 2019
Emerging-markets currencies are hitting the strongest levels versus the dollar since the end of January, according to MSCI index data. pic.twitter.com/OqJwho0V9R
— Lisa Abramowicz (@lisaabramowicz1) July 11, 2019
If $BTC has intermediate correction then $XRP will go to $.1600 pic.twitter.com/tqQ0nuHZr4
— Peter Brandt (@PeterLBrandt) July 11, 2019
A couple of thoughts about Copper:
1) Overall view it more as an economic than stock market indicator (it's a PhD, not a CMT)
2) Has been a good market indicator for EM – virtually all net gains there in past 20 years have come when Copper > 200DMA
— Willie Delwiche (@WillieDelwiche) July 11, 2019