Sponsored By:

Today’s Summary
Wednesday, July 10th, 2019
Indices: US stocks were higher in today’s session with the Dow Jones Industrial Average gaining 77 points or 0.29%. The Nasdaq was the strongest of the major indices, advancing 0.75%.
Sectors: Energy led, gaining 1.36%. Financials lagged, falling 0.39%.
Commodities: Crude Oil futures jumped 4.53% to $60.43 per barrel. Gold futures climbed 1.10% to $1,415 per ounce.
Currencies: The US Dollar Index fell 0.42%.
Interest Rates: The US 10-year Treasury yield fell to 2.061%.
Here are the best charts, articles, and ideas being shared on the web today!
Chart of the Day
Today’s chart of the day was shared in a blog post from Chris Kimble (@KimbleCharting). It’s a weekly candlestick chart of Gold Miners ETF, $GDX. Chris notes that $GDX is testing an important resistance level, around $25.60-25.75. This level coincides with the 61.8% Fibonacci retracement of the 2016-2018 decline. As you can see, $GDX visited this level three times in the past few years, only to be smacked down each time. Resistance levels are similar to a wall getting hit with a sledgehammer, where every time you hit it, it gets weaker and weaker. Will the fourth time be the charm for Gold Miners? Chris calls this “its most important breakout test in the past 3-years” We’ll be sure to keep an eye on this one.
Quote of The Day
“Sometimes the only solution when the data is very noisy is to focus more on process than on results.”
– Nate Silver (Statistician)
Top Links
Arthur Hill of StockCharts.com highlights one of the most attractive cannabis stocks, GW Pharmaceuticals ($GWPH). He shows that it’s one of the strongest names in the cannabis space and explains why he thinks it’s headed higher.
MKM’s O’Hara Makes the Case to Short US Treasury Futures – Bloomberg
In this clip from Bloomberg, JC O’Hara of MKM Partners joins host Abigail Doolittle to discuss what he’s seeing from the charts of Gold and US Treasury Yields.
Trading the Breakout in Mid-Cap Industrials – Real Vision
Tom Bruni of All Star Charts made an appearance on Real Vision today to outline a trade idea on Herman Miller ($MLHR).
New Highs for S&P 500 But Not a Lot of Sectors – Bespoke
In this note from Bespoke, they discuss the lack of participation they’re seeing from the individual sectors of the S&P 500. They point out that none of the sectors have made new highs in terms of their relative strength versus the S&P 500.
Boeing is a Buy if it Holds this Level, Technician Says – CNBC
In this clip from CNBC, Todd Gordon of TradingAnalysis.com breaks down the technicals on Boeing ($BA). He’s bullish on the stock as long as it stays above the $310 level.
Top 10 Tweets
S&P 500 hits 3,000 for the first time. $SPX pic.twitter.com/OqxA3rT3Dm
— Charlie Bilello (@charliebilello) July 10, 2019
The S&P 1500 AD Line continues to lead with new highs in February, April, June and July. This is a great index for breadth indicators because it includes 500 large caps $SPX, 400 mid caps $MID and 600 small caps $SML, as well as 919 NYSE stocks and 581 Nasdaq stocks. pic.twitter.com/HecaIW1bK7
— Arthur Hill, CMT (@ArthurHill) July 10, 2019
If for some reason you care about round number price levels, here's the past 22 the S&P 500 has hit. $SPX pic.twitter.com/rLXsGaFVQj
— Andrew Thrasher, CMT (@AndrewThrasher) July 10, 2019
Always pull $$ out of markets at the worst time. Another sign we could break out here for a while. Look at all the other low points on this chart and compare to corresponding points on $SPX https://t.co/mJpwWYJOXF
— David Settle, CMT (@davidsettle42) July 10, 2019
I think the 'Momentum Stocks Are Back' could just be getting started $MTUM $SPY pic.twitter.com/U08YDvFY1t
— J.C. Parets (@allstarcharts) July 10, 2019
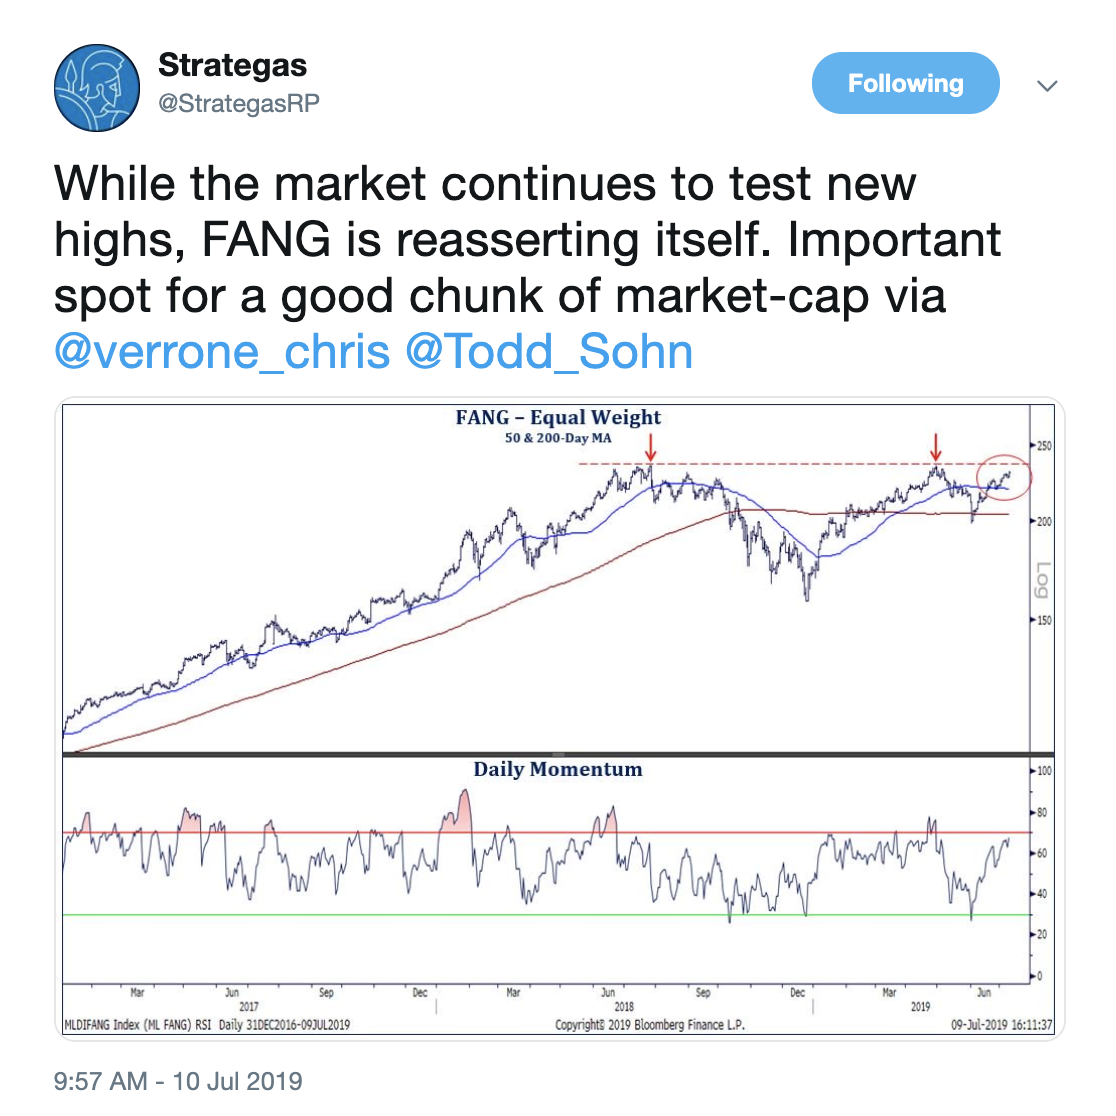
The ? #cannabis – $NDX divergence they began 6/2 continues to continue ? pic.twitter.com/BSSebrf3QE
— Todd Harrison (@todd_harrison) July 10, 2019
After last weeks pullback, #Crudeoil recovered and cracked a downtrend line. It also cleared last week's high and is challenging the #Fibonacci .618 retracement again. Targeting $66-per-barrel on the next leg up? I'm a buyer. $USO $CL_F pic.twitter.com/Wgk4h9LxrI
— Jason Pearce (@TheJaytrader) July 10, 2019
Gold relative to the US Dollar is breaking above a trendline going back eight years. Could be another positive sign for gold here. pic.twitter.com/O3u9KLTKBg
— Ryan Detrick, CMT (@RyanDetrick) July 10, 2019
** @TrendSpider just stepped their charting with "Alphatrends Anchored VWAP"
It is still in beta and will be released to all users in the next couple of wks, great job Trend Spider team!!this morning $NVDA came right up to the VWAP anchored from the high last week pic.twitter.com/5SduWY4veR
— Brian Shannon, CMT (@alphatrends) July 10, 2019
Is Ethereum seeing a major breakdown below 2-year support against Bitcoin at 0.02460? $ETH.X $BTC.X #ETHBTC pic.twitter.com/uMsSOvWNQg
— Matt Weller CFA, CMT (@MWellerFX) July 10, 2019