Commodities See a Sharp Correction 📉 The Chart Report

Chart of the Day
🏆 Today's Chart of the Day was shared by Chris Kimble.
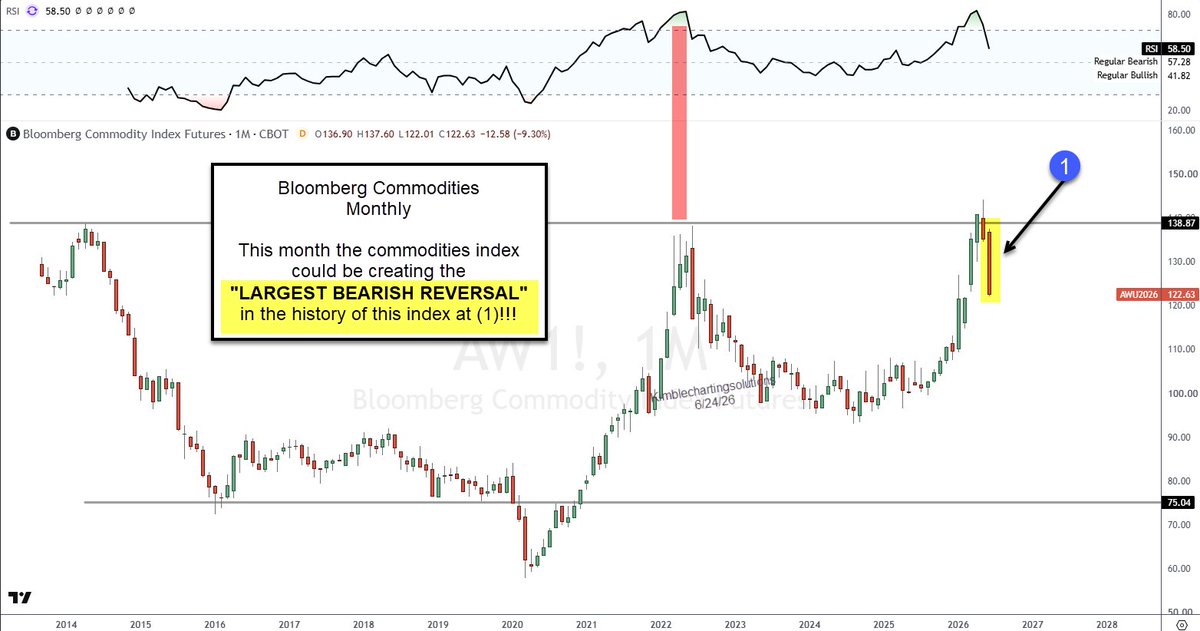
The Bloomberg Commodity Index closed at new multi-month lows while on track for its third-longest weekly losing streak over the past twenty years.
This weakness comes after the index reached overbought momentum readings earlier this year but ultimately failed to break above the pivot highs established in 2014 and 2022.
Recent strength from the U.S. Dollar has also weighed heavily on the broader complex, with Gold, Silver, and Oil seeing significant downside action today.
The Takeaway: Commodities are providing the latest reminder that failed moves often lead to fast moves in the opposite direction.
More Great Charts
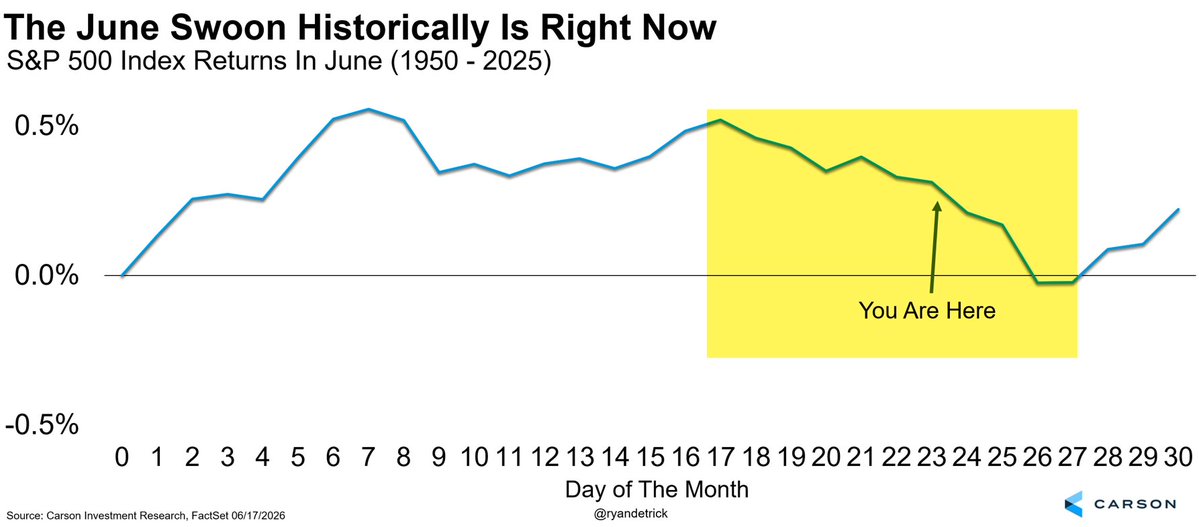
The market is now a little past the halfway point of one of its weakest seasonal periods of the year.
See the whole post from Ryan Detrick.
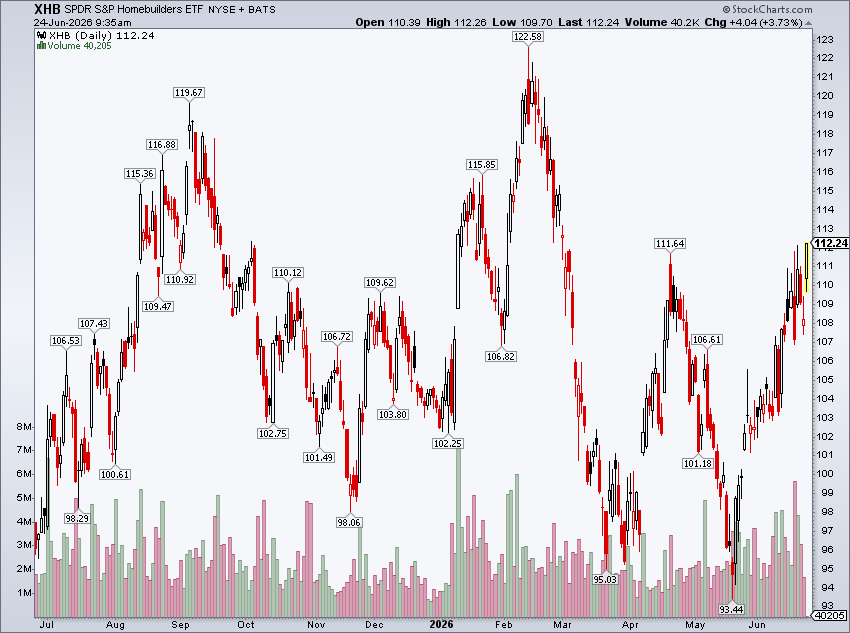
The Homebuilders ETF closed at fresh 3-month highs.
View the entire tweet from Mike Zaccardi.
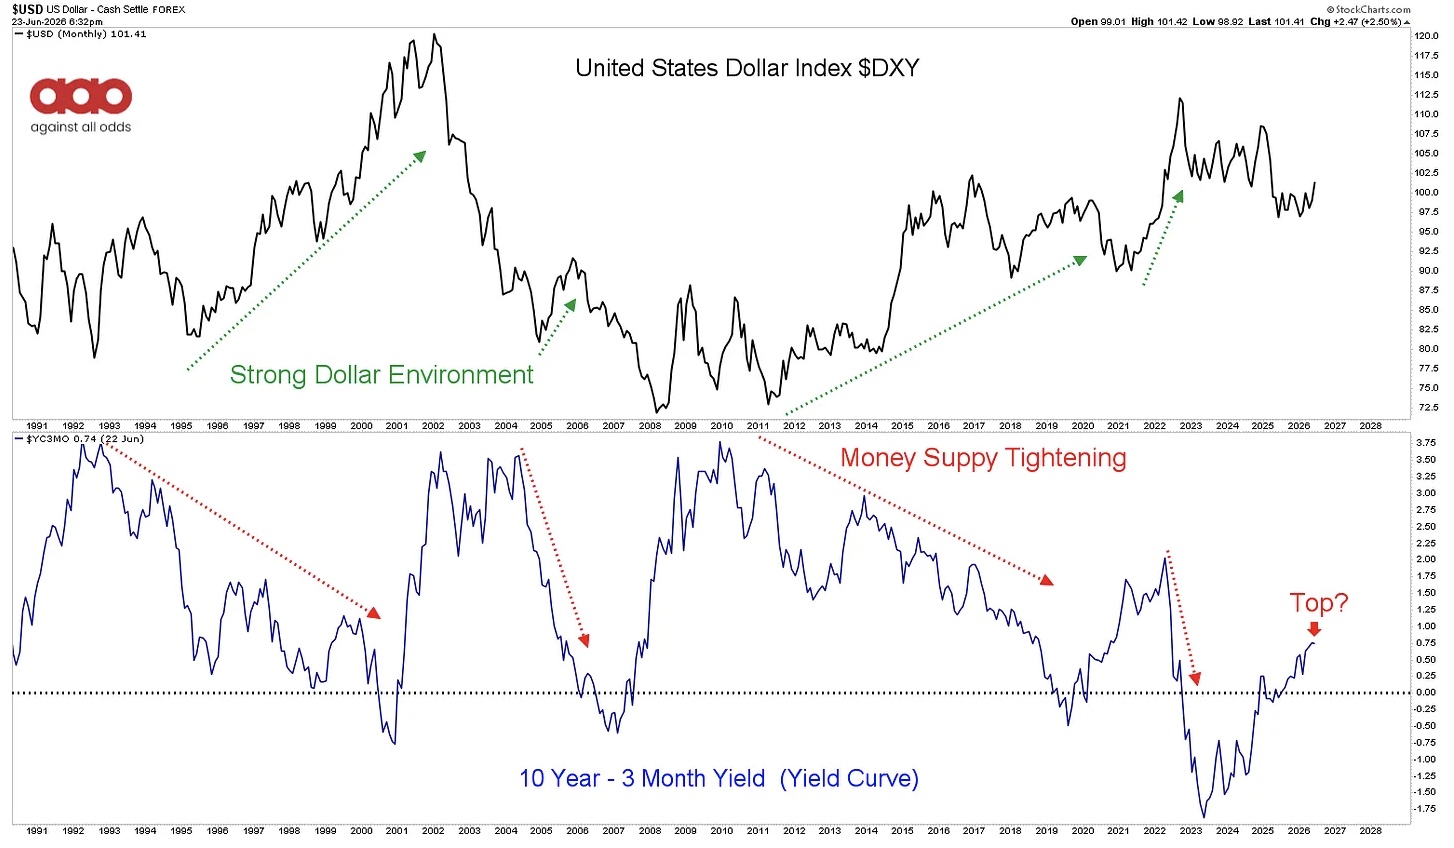
Historically, a strong U.S. Dollar has often coincided with tighter financial conditions and less liquidity in the market.
Read the full analysis from Jason Perz.
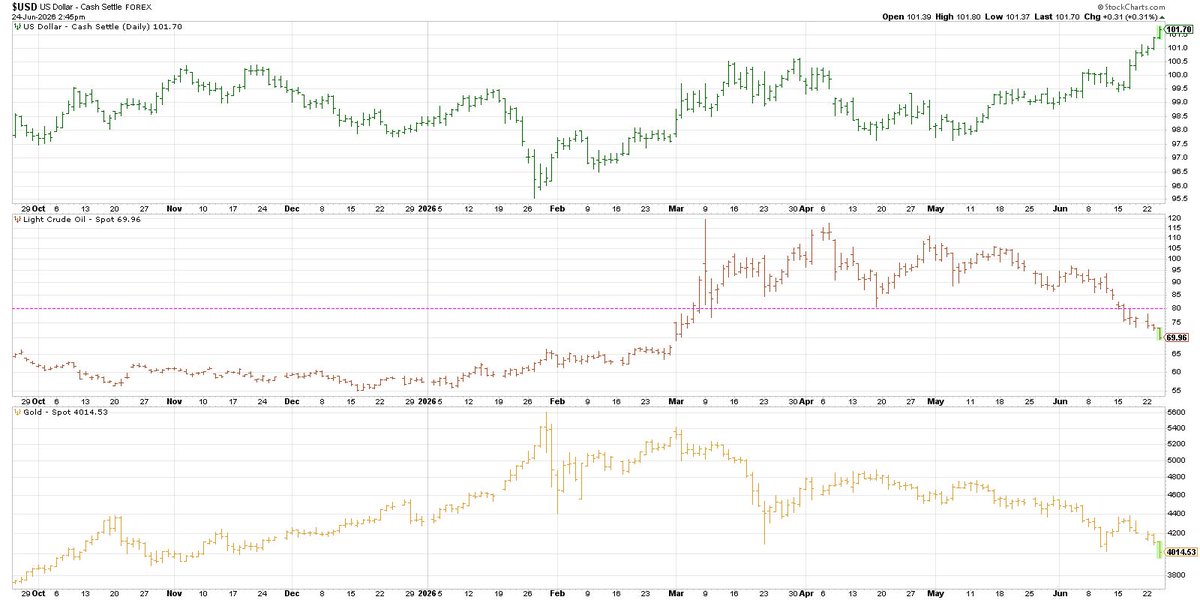
The resurgence in the U.S. Dollar is causing some volatility within commodities.
Examine the complete post from David Keller.
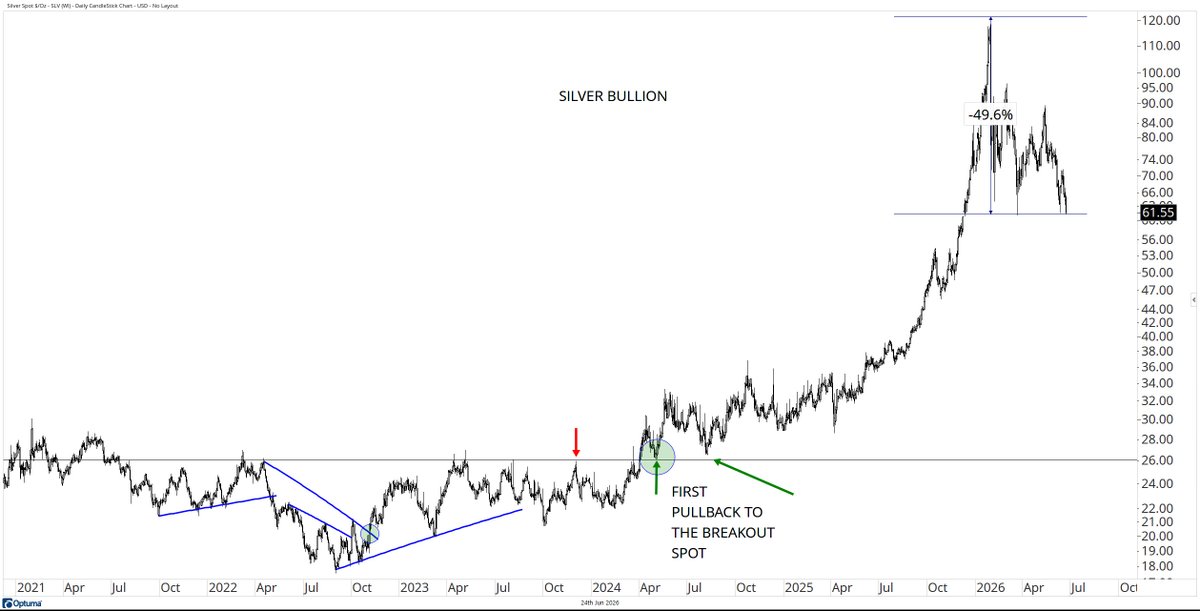
Silver has now fallen roughly 50% from its January peak.
Check out the entire tweet from David Cox.
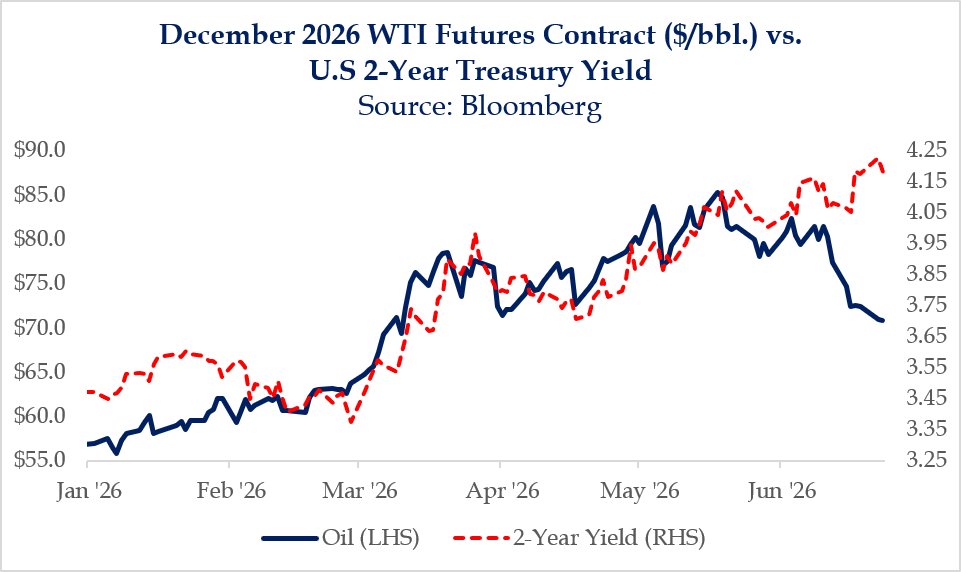
Oil prices have diverged from the U.S. 2-Year Yield.
Read the full article from Ryan Grabinski.
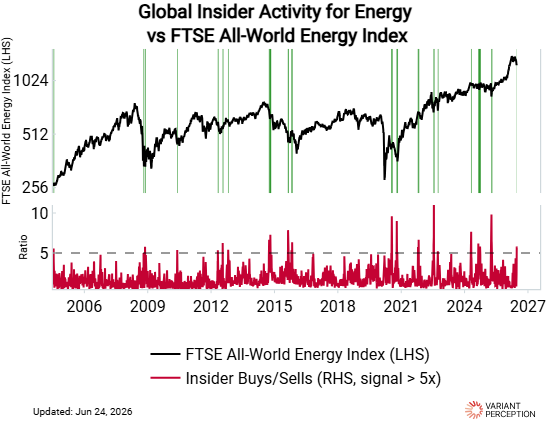
Energy insiders are starting to buy Energy stocks again.
View the whole post from Variant Perception.
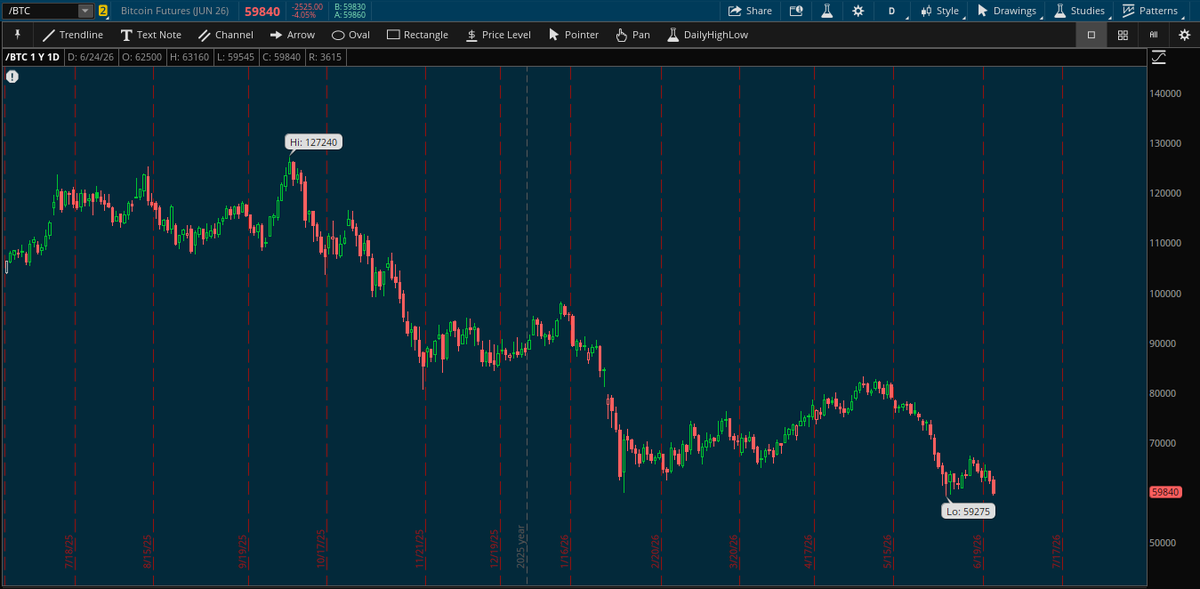
Bitcoin saw an intra-day drop below $60k.
See the entire tweet from Quant Data.
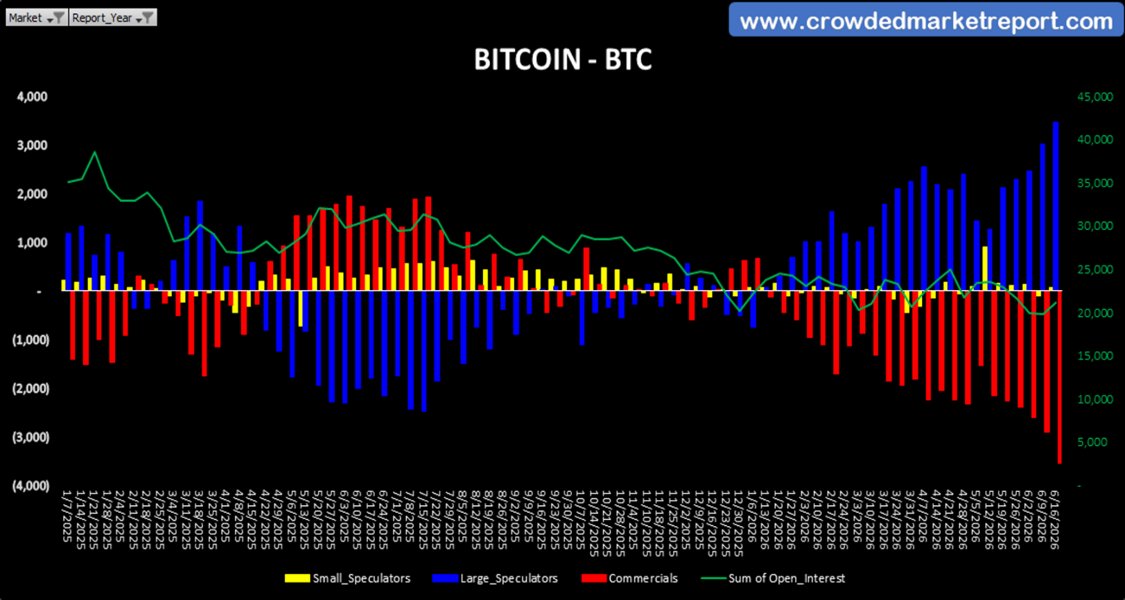
Bitcoin positioning has reached an extreme, with Large Speculators holding record-long exposure and Commercials holding record shorts.
Examine the complete post from Jason Shapiro.
The Chart Report curates best-in-class technical analysis from across the web.
If you’d like to share a chart or just say hello, email us at [email protected]