Sponsored By:

Today’s Summary
Monday, June 17th, 2019
Indices: US stocks kicked off the week on a positive note today with the Dow Jones Industrial Average gaining 23 points or 0.09%. The Russell 2000 was the strongest of the major indices, up 0.67%.
Sectors: Communications led, gaining 1.12%. Materials lagged, falling 0.95%.
Commodities: WTI Crude Oil futures were lower by 1.07% to settle at $51.93 per barrel. Gold futures closed slightly lower by 0.13% and are trading around $1,343 per ounce.
Currencies: The US Dollar Index fell just 0.05%.
Interest Rates: The US 10-year Treasury yield moved slightly lower to 2.091%.
Here are some of the best charts, articles, and ideas being shared on the web today!
Chart of the Day
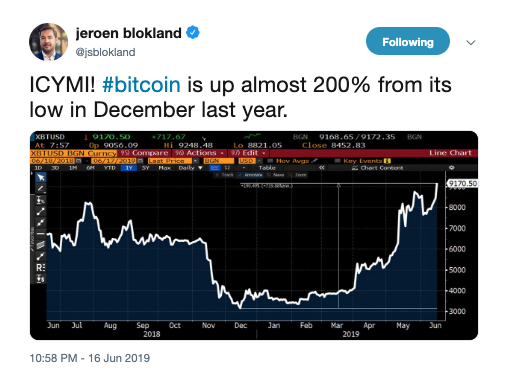
Today’s chart of the day was shared on Twitter by Jeroen Blokland (@jsblokland). It’s a line chart of Bitcoin prices over the past year. Bitcoin printed a fresh 52-week high today around $9,430. Jeroen highlights the remarkable comeback that Bitcoin has made this year. It’s up about 150% so far in 2019, after falling 72% in 2018. $10,000 will be an important test for Bitcoin, as it represents a key psychological level. It’ll be interesting to see if this rally has enough steam to breakout and hold above it.
Quote of The Day
“We decided that systematic trading was best. Fundamental trading gave me ulcers.”
– Jim Simons (founder of Renaissance Technologies)
Top Links
Solar stocks have been significantly outperforming the broader market so far in 2019. In this report, we highlight some of the individual names in the space that we think have the best risk/reward setups right now. Why Technical Analysis – StockCharts.com
In this article, Greg Morris discusses how he got into technical analysis and why it’s so important to study price action.
What the New High in The Advance-Decline Line Means for Stocks – The Fat Pitch
Urban Carmel points out that the cumulative advance-decline line made a new all-time high last week for both the NYSE and S&P 500. He explains why this is good news for stocks and discusses some of the limitations of the advance-decline line.
Sector Leadership Traits – Bespoke
In this piece, Bespoke challenges the idea that the market can’t rally without Financials. They analyze the data over the past decade to prove that Financials don’t lead the market the way many believe they do.
Looking for Strength in Last Week’s Market – Forbes
Technician and Forbes Contributor, Tom Aspray reviews last week’s price action and explores what it signals going forward. He gives his take on the major indices, sectors and Treasury yields.
Top 10 Tweets
The best rallies keep as many people as possible as skeptical as possible for as long as possible.
— Walter Deemer (@WalterDeemer) June 17, 2019
$SPY Volume today the lowest since last August -8/9/18- Breadth just fractionally positive (Flat) Healthcare, Energy REITS outperformed, while Transports fell over 1% w/ Financials lagging nearly as much, at -0.93%. https://t.co/X2vMH2vVMN pic.twitter.com/MyImewguJP
— Mark Newton (@MarkNewtonCMT) June 17, 2019
2nd lowest volume day in 2019 pic.twitter.com/MlRaBYzRfx
— Tom Hearden (@followtheh) June 17, 2019
US at a new relative high vs. the world. For investors, it still pays to stay local!$SPX $SPY $ACWI pic.twitter.com/WuPr4lgGBm
— David Keller, CMT (@DKellerCMT) June 17, 2019
$XBI triggering this inverse H&S on breaking above key resistance zone around 84.00. D1 chart. #bullish if holds above both. #biotech pic.twitter.com/Sd3oOViBGx
— Matt (@commander10) June 17, 2019
$LS_F $WOOD $XHB Lumber with a massive week last week that I haven’t seen many talk about. Would be a positive if above $400~ pic.twitter.com/sI0jZvAY4x
— Nick Marino (@AlphaEyeCharts) June 17, 2019
(Relatively) quietly, #Bitcoins have almost tripled in price this year. How you feel about the future depends, in simple terms, on which chart you take as baseline: YTD would suggest more caution than the longer-term picture which suggests this rally is less speculative in nature pic.twitter.com/mAranWVtea
— Mohamed A. El-Erian (@elerianm) June 17, 2019
$GOOGL has had it with the $1000 area. After at least 5 bounces off this area from Dec-17 to Dec-18, the stock is finding buyers above this zone in June (higher low) and making a bid to fill the June 3rd gap. Stock is also 8.5% of $QQQ. pic.twitter.com/y1PlK3sBKX
— Arthur Hill, CMT (@ArthurHill) June 17, 2019
$uber is trying to frustrate as many as possible, or Lull them to sleep pic.twitter.com/hNWwQJOYPB
— Scott Redler (@RedDogT3) June 17, 2019
LOL pic.twitter.com/YNCNy0K5QP
— Ian McMillan, CMT (@the_chart_life) June 17, 2019