Sponsored By:

Today’s Summary
Wednesday, June 12th, 2019
Indices: US stocks were lower in today’s session with the Dow Jones Industrial Average falling 44 points or 0.17%. The Russell 2000 managed to eke out a small gain of 0.05%.
Sectors: Utilities led, gaining 1.30%. Energy lagged, falling 1.41%.
Commodities: WTI Crude Oil futures dropped 4.11% to settle at $51.08 per barrel. Gold futures were higher by 0.45% and are trading around $1,337 per ounce.
Currencies: The US Dollar Index rose 0.31%.
Interest Rates: The US 10-year Treasury yield fell to 2.122%.
Here are some of the best charts, articles, and ideas being shared on the web today!
Chart of the Day
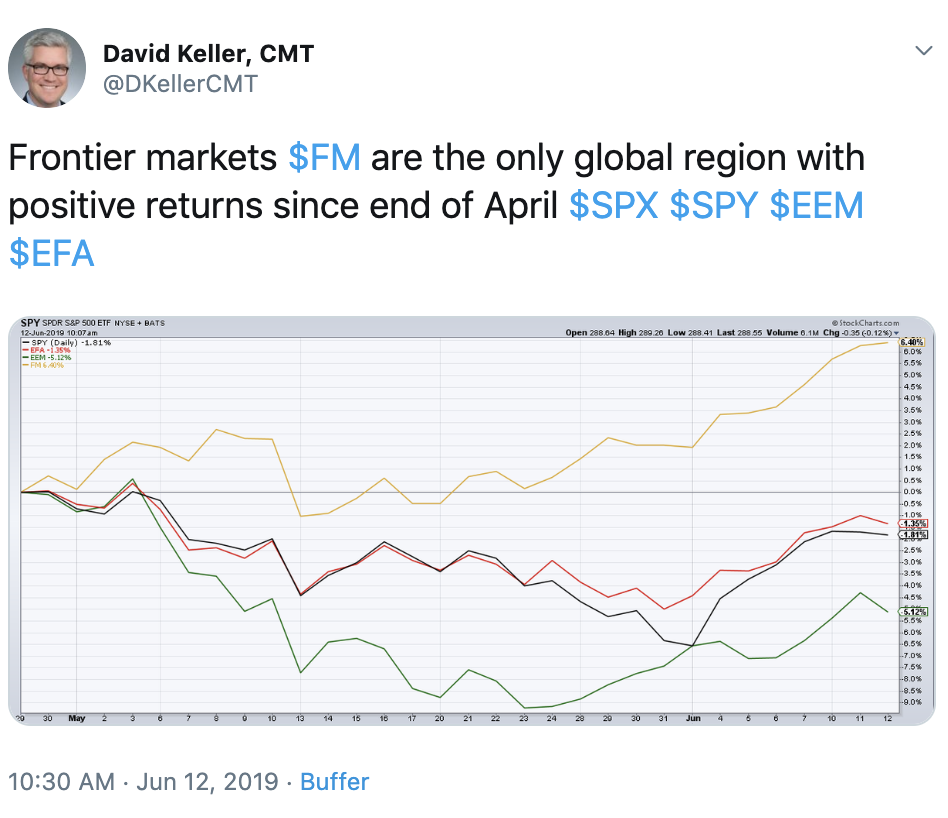
Today’s chart of the day was shared on Twitter by David Keller (@DKellerCMT). It’s a chart comparing the performance of the S&P 500 ($SPY), Emerging Markets ($EEM), Developed Markets ($EFA) and Frontier Markets ($FM), since the end of April. As you can see, Frontier Markets have significantly outperformed the rest of the pack. The Frontier Markets ETF, $FM is comprised of stocks from the riskiest and least economically developed countries in the world including Vietnam, Kuwait, and Argentina. The fact that investors prefer these countries over some of the more developed countries indicates risk appetite, which we think is positive for equities on a broader scale. For a deeper-dive into Frontier Markets check out our newest report.
Quote of The Day
“Everybody has a plan until they get punched in the mouth”
– Mike Tyson (Professional Boxer)
Top Links
Frontier Markets have been one of the hottest areas of the market lately. In this report, we examine the Frontier Markets ETF, $FM and outline how traders should play this opportunity.
Market Thoughts from David Settle – The Chart Report
In this report, we cover the technician, David Settle’s current market outlook. He touches on stocks, interest rates, and the US Dollar.
Ford Shines within a Rather Dull Auto Group – Arthur Hill – StockCharts.com
Arthur Hill of StockCharts.com points out that shares of Ford ($F) have been showing relative strength compared to their industry group. He also likes how the chart is set up and thinks it has the potential for further upside from here.
Coffee About to Heat Up and Breakout? – Kimble Charting Solutions
In this short read, Chris Kimble takes a look at the weekly chart of Coffee futures. He notes that Coffee has fallen nearly 60% in the past five years but is now shaping up for a potential rally.
I Discovered Technical Analysis by Necessity – All Star Charts
In this video, JC Parets explains how he became interested in Technical Analysis years ago. He details the various aspects of the discipline that were the most attractive to him.
Top 10 Tweets
From its June 3rd intraday low (24,680.57) to yesterday's intraday high (26,248.67), the DJ Industrial Average gained 6%. It also encountered resistance as it approached its April 4th intraday high of 26,695.96, thus a pause is normal and necessary in order to digest this gain.
— Ralph Acampora CMT (@Ralph_Acampora) June 12, 2019
The Global A/D line made new highs yesterday.
Look at countries like Switzerland, Russia, India, Brazil, and Greece. There is a lot of strength globally, suggesting there likely won't be the global recession so many are expecting. pic.twitter.com/QZ9brWc4zo
— Ryan Detrick, CMT (@RyanDetrick) June 12, 2019
$RTY_F daily. Russell continues to lag behind. I would argue that if it drops below 1450 level, it will retest December lows. Somehow Russell is in dissonance with the 52w low/high ratio on S&P500. pic.twitter.com/2DCz602xTb
— Yuriy Matso (@yuriymatso) June 11, 2019
Much of the bull case for equities has been riding on the uptrend of the NYSE Advance-Decline Line. But its 21-day Rate of Change has seen a steady negative divergence over the past 5 months. We can't help but wonder if the momentum of the A-D Line is trying to tell us something. pic.twitter.com/qqvYQUMSFm
— Jeffrey W. Huge, CMT (@Alpha_Insights) June 12, 2019
'Go on son'. $GDX pic.twitter.com/HNAPNYVZGL
— Teddy Vallee (@TeddyVallee) June 12, 2019
Huge Crude puke into the close pic.twitter.com/ytKSsGwhvc
— Tom Hearden (@followtheh) June 12, 2019
Technically stunning crude oil chart…. Perfect re-test of breakdown and now headed for the big neck line. Unlikely to break on first attempt but Im guessing it breaks in the late summer. Ruh Roh. pic.twitter.com/cLtlmo03RV
— Raoul Pal (@RaoulGMI) June 12, 2019
$XLE downtrend, below all moving averages on the daily. So so weak. $XOP $OIH $XES $USO pic.twitter.com/udjze81Tvz
— TradeTheTrader (@TradeTraders) June 12, 2019
$NFLX back to support…again pic.twitter.com/JZFFY9QxFl
— BostonCharts (@bostonchaahhts) June 12, 2019
The new Raindrop charts from @TrendSpider are fascinating. The most interesting development I've seen in charting in a while.
A Raindrop chart essentially shows where volume was heaviest alongside a traditional candle. This chart shows $TSLA right now. pic.twitter.com/t1lx6yI3xS
— Scheplick (@scheplick) June 12, 2019